What Are the New Findings?
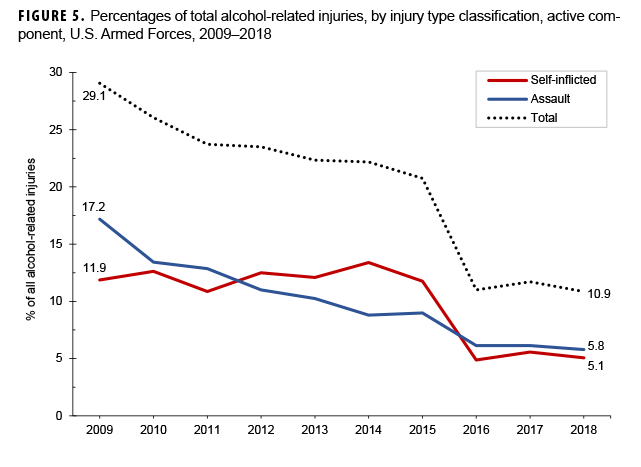
The crude overall incidence rate of alcohol-related encounters among U.S. active component service members during 2009–2018 was 75.3 per 10,000 person-years, with a 14.0% decline over the study period. The pattern of annual rates of alcohol-related injuries differed by deployment status, and 17.1% of encounters had a co-occurring injury diagnosis. Self-inflicted injuries and assaults each accounted for around 10% of the injuries, and both trended downward during the 10-year period.
What Is the Impact on Readiness and Force Health Protection?
The U.S. Armed Forces invests considerable time, money, and resources in training and equipping service members. Alcohol-related incidents with and without injury affect individual readiness and unit mission preparedness and can prematurely end a service member's career. Understanding more about factors associated with alcohol misuse and injury patterns may help identify targets for future interventions.
Abstract
The military has a high prevalence of alcohol misuse, which can lead to injuries and negative health outcomes. This report characterizes the rate of alcohol-related emergency department and inpatient encounters in the military and the percentage of encounters with co-occurring injury. Between Jan. 2009 and Dec. 2018, there were 75.3 alcohol-related encounters per 10,000 person-years, with a 14.0% decline over the study period. Rates were higher among men, those aged 21–25 years, non-Hispanic whites, Army service members, junior enlisted, and those in combat-specific occupations compared to their respective counterparts. An increase in the rate of encounters in 2010 and 2012 mirrored the surge of troops in Afghanistan. Moreover, 17.1% of alcohol-related encounters were associated with co-occurring injuries. Intentional injuries constituted the largest mechanism of injury, and the percentage of injuries attributable to intentional causes trended down over the study period. Policies and programs that discourage heavy drinking, especially among those exposed to combat, have the potential to decrease medical encounters and injuries related to alcohol misuse.
Background
The Centers for Disease Control and Prevention (CDC) defines binge drinking as 4 or more drinks on 1 occasion for a woman and 5 or more for a man. Heavy drinking is defined as 8 or more drinks per week for a woman or 15 or more drinks per week for a man. The CDC finds that binge drinking is the most common form of excessive alcohol use, and that most adults who binge drink are not alcohol dependent.1
Excessive use of alcohol can lead to a variety of both short- and long-term health effects and can result in emergency department (ED) visits and hospitalizations. Injuries such as those associated with motor vehicle crashes, falls, drownings, and burns have been shown to be correlated with preceding alcohol use.2 In 2016, the CDC reported that alcohol consumption was associated with 10% of deaths among working-age adults in the U.S.1 The World Health Organization reported that alcohol consumption accounted for 5.3% of all deaths worldwide in 2018.3
There was a substantial increase in the number and rate of alcohol-related ED visits between 2006 and 2014 in the U.S., with 45- to 54-year-olds having the highest overall rates of ED visits in 2014.4 While men typically have been heavier and more frequent drinkers and have also experienced more alcohol-related injuries than women in the past, studies in the last 2 decades have shown a narrowing of the gap between men and women in the prevalence of binge drinking and alcohol-related injuries.5,6
Active duty service members are known to have a higher prevalence of alcohol use, heavy drinking, and binge drinking than the general population.7 Those who drink and who binge drink by the end of high school have higher propensity to both express intent to join and actually join the military.8,9 Additional research shows that while binge and heavy drinking are an accepted part of military culture, rates of binge and heavy drinking are also significantly higher among those with combat exposure.10,11 The 2015 Department of Defense (DOD) Health Related Behaviors Survey showed that around 30% of service member respondents were current binge drinkers in 2014, compared to 24.7% of U.S. adults over the age of 18. Moreover, about 8% of service member respondents reported a negative consequence of drinking.7 Quantifiable alcohol-related adverse events have been characterized in some military populations,12,13 but not across the entire U.S. Armed Forces.
Emergency room visits and hospitalizations for alcohol-related disorders are increasingly costly in the civilian sector because of both health care costs and lost productivity.14 Health care expenditures and lost productivity similarly impact military members. A study of TRICARE expenditures noted alcohol-related medical care to cost around $425 million a year in 2006,15 which would be over $500 million in 2018, after adjusting for inflation. In addition, significant resources are required to address behavioral and performance issues associated with alcohol misuse in the military. Alcohol-related disorders result in arrests, fights, injuries, lost opportunities for promotion, and early discharge of service members whom the DOD has spent significant time and resources training.16 These factors converge to negatively impact mission readiness and force lethality.
This investigation characterizes the rates of alcohol-related ED visits and hospitalizations in the active component during 2009–2018 as well as the percentage of those visits in which an injury was sustained. Trends in these data over time are also described.
Methods
This study utilized a retrospective cohort design with a surveillance period from 1 Jan. 2009 through 31 Dec. 2018. The surveillance population included any member of the Army, Navy, Air Force, or Marine Corps who served in the active component at any point during the surveillance period. All data used to identify cases of alcohol-related visits with and without co-occurring injuries were derived from inpatient and outpatient records within the Defense Medical Surveillance System (DMSS), which is maintained by the Armed Forces Health Surveillance Branch. Click to closeDirect CareDirect care refers to military hospitals and clinics, also known as “military treatment facilities” and “MTFs.”Direct care refers to care rendered within the Military Health System (MHS). Network care refers to care rendered by a civilian treatment facility and is captured via TRICARE claims. ED encounters and hospitalizations of active component members of the U.S. Armed Forces in both military and civilian (if reimbursed through the MHS) treatment facilities were included. Each individual was allowed a maximum of 1 ED visit per day. When an ED visit and hospitalization occurred on the same day, the hospitalization was prioritized over the ED visit.
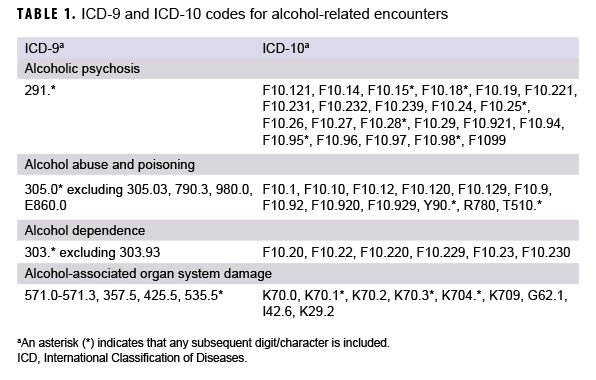
ED visits were defined as those with Medical Expense Performance Reporting System codes BHI* or BIA* or containing Current Procedural Terminology (CPT) codes 99281–99285 in 1 of the first 4 diagnostic positions. ED visits and hospitalizations with an alcohol-related International Classification of Disease, 9th or 10th Revision (ICD-9 or ICD-10, respectively) diagnosis code in any of the first 3 diagnostic positions of the visit were considered to be alcohol-related encounters. Alcohol-related encounters were categorized into 1 of the following 4 groups: alcoholic psychosis, alcohol dependence, alcohol abuse and poisoning, and alcohol-associated organ system damage. ICD-9 and ICD-10 codes used to identify these events are listed in Table 1.
Alcohol-related ICD-10 codes for which there were no ICD-9 equivalents, such as alcohol-induced pancreatitis, were omitted to avoid creation of an artificial increase in rates of alcohol-related events with the transition from ICD-9 to ICD-10 in 2015. Demographic and military covariates included sex, age group, race, ethnicity, education level, marital status, service branch, rank/grade, military occupation, and deployment to Operation Enduring Freedom, Operation Iraqi Freedom, or Operation New Dawn before any alcohol-related encounter. Deployment history was defined using Defense Manpower Data Center (DMDC) deployment data for Army and Air Force and post-deployment health assessment (PDHA) forms for the Navy and Marine Corps, given that at the time of the analysis the DMDC deployment data were not complete for the latter. Both DMDC and PDHA data are housed in the DMSS. An individual service member could have multiple qualifying alcohol-related ED visits or hospitalizations during the study period and could contribute person-time in different demographic categories as appropriate over time (age, rank, having a deployment, etc.). Statistical analyses were carried out using SAS/STAT software, version 9.4 (2014, SAS Institute, Cary, NC) and Stata IC, version 15.1 (2017, StataCorp LLC, College Station, TX).
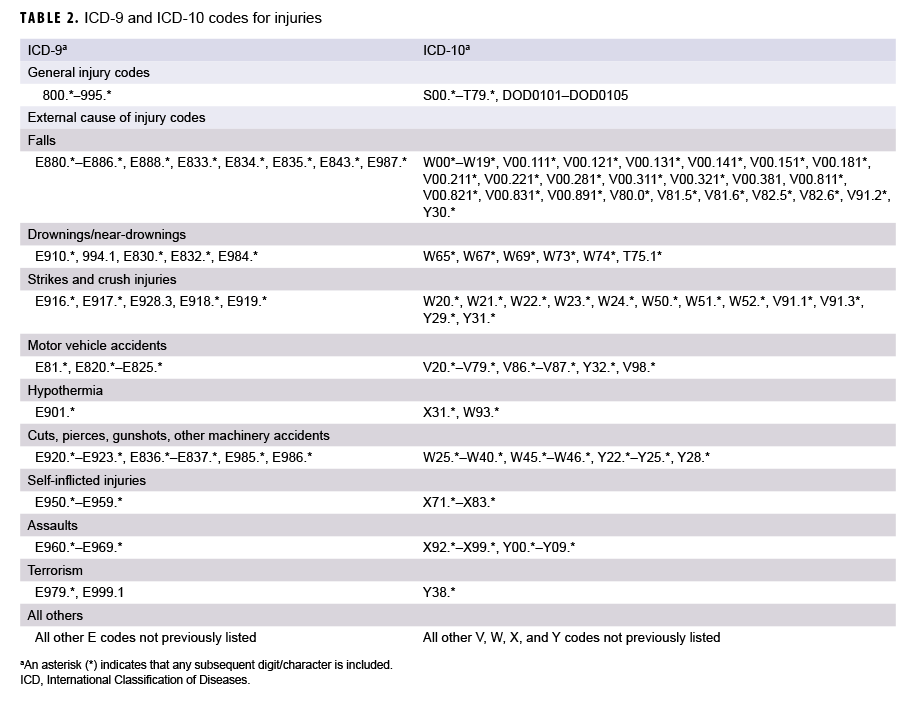
To examine the second objective, service members' ED visits and inpatient hospitalizations qualifying as alcohol-related events collected for the first objective were analyzed. All events with an injury code listed in any diagnostic position were considered to be alcohol-related events with co-occurring injury. In addition to the alcohol-related code and injury code, when external cause of injury codes were included, events were categorized as follows: unintentional falls; strikes and crush injuries; drownings and near-drownings; motor vehicle accidents; hypothermia; cuts, pierces, gunshots, and other machinery accidents; intentional injuries; and all other. When a single ED visit or hospitalization had more than 1 external cause of injury code, a maximum of 1 code was accepted per category. For example, a single ED visit could be counted for both a fall and a strike injury, but not for 2 fall injuries. ICD-9 and ICD-10 codes used to identify injuries are listed in Table 2.
Using person-years (p-yrs) derived from individuals serving in the active component during each year of observation as the denominator, rates of alcohol-related events were stratified by year and by demographic and military covariates. Using the alcohol-related events as the denominator, the percentage of alcohol-related events in which injuries co-occurred was also stratified by year and by the above covariates. Descriptive statistics were used to characterize trends over the surveillance period and to make comparisons between subgroups.
Results
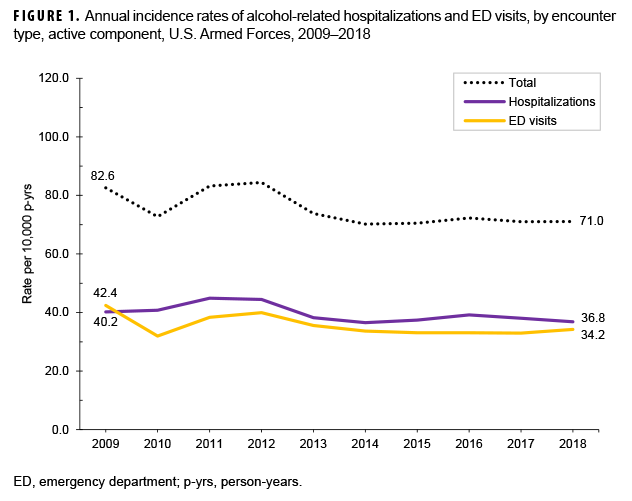
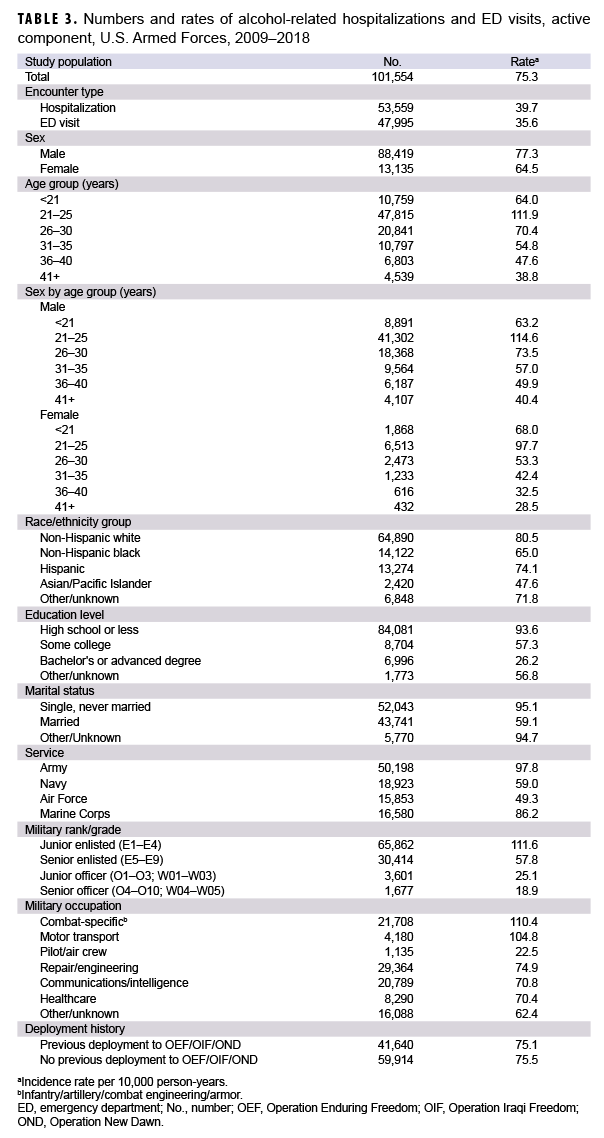
During the 10-year study period, there were 101,554 alcohol-related encounters, including both ED visits and hospitalizations among active component service members, with an overall crude rate of 75.3 encounters per 10,000 p-yrs (Table 3). Among these, 52.6% (n=53,368) of encounters were for alcohol abuse and poisoning, 35.0% (n=35,584) were for alcohol dependence disorders, 11.5% (n=11,640) were for alcoholic psychosis, and 0.9% (n=962) were for alcohol-related organ damage (data not shown). ED visits and hospitalizations occurred at crude overall rates of 35.6 and 39.7 per 10,000 p-yrs, respectively (Table 3). Crude annual rates of encounters rose between 2010 and 2012, peaked at 84.4 per 10,000 p-yrs in 2012, and declined thereafter (Figure 1). Overall, there was a 14.0% decrease in the rate of encounters over the 10-year period, from 82.6 encounters per 10,000 p-yrs in 2009 to 71.0 encounters per 10,000 p-yrs in 2018.
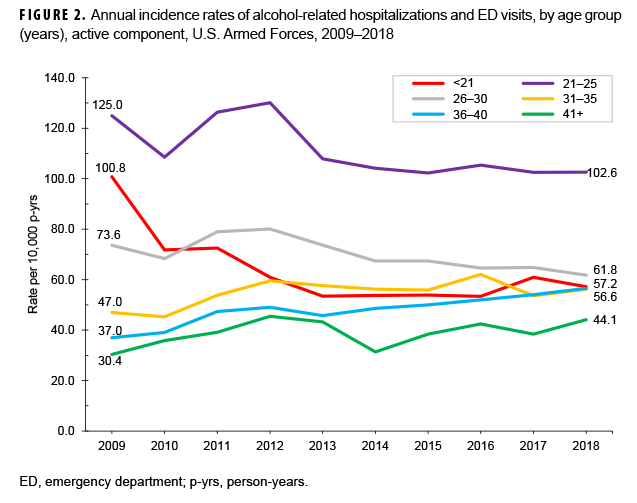
Examination of overall rates of alcohol-related encounters by sex and age group indicated that men had a higher rate of alcohol-related encounters than women in every age group except among those under 21 years of age (women: 68.0 per 10,000 p-yrs; men: 63.2 per 10,000 p-yrs) (Table 3). Those service members aged 21–25 years had the highest overall rate of alcohol-related encounters for both sexes (Table 3). There was a marked decrease in the annual encounter rate in the youngest age group for both sexes over time, from 100.8 per 10,000 p-yrs in 2009 to 57.2 per 10,000 p-yrs in 2018. Rates for the 36–40-year-old age group and the 41 years and older age group, while generally lower than the rates for other age groups, increased slightly between 2009 and 2018 (Figure 2).
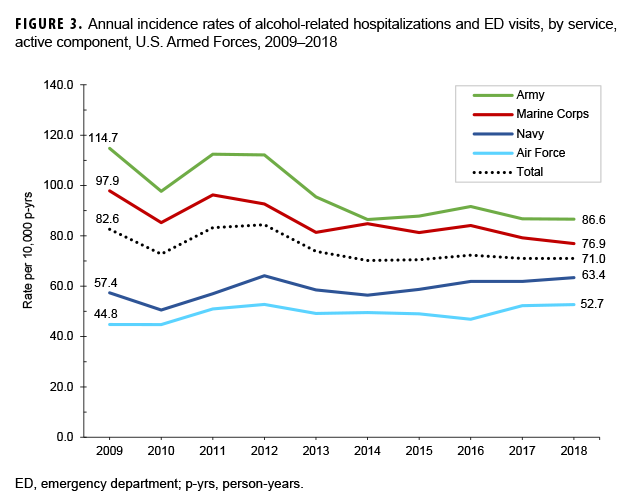
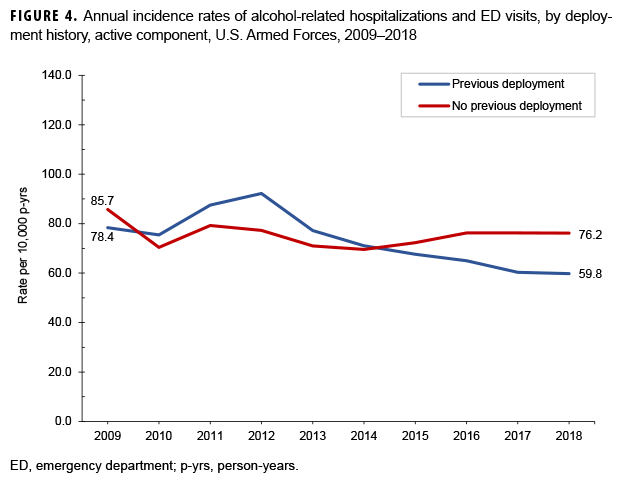
Across the services, overall alcohol-related encounter rates were highest among Army members (97.8 per 10,000 p-yrs) and lowest among Air Force members (49.3 per 10,000 p-yrs) (Table 3). Throughout the surveillance period, the pattern of rates among members of the Army and the Marine Corps were broadly similar, with the greatest decreases between 2012 and 2018. Rates among Navy and Air Force members increased slightly over the course of the 10-year period (Figure 3). The rates of alcohol-related encounters for those without a deployment remained relatively stable over the study period, while the rates for those with a deployment peaked in 2012 and decreased steadily thereafter (Figure 4). Combat-specific and motor transport occupations had the highest rates among occupation types, and pilots and air crew the lowest (Table 3).
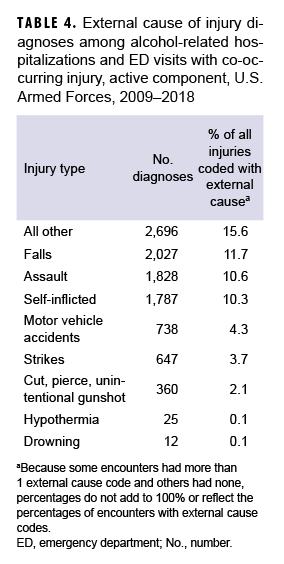
A total of 17,324 alcohol-related encounters (17.1%) had a co-occurring injury, with males, Marines, the 2 youngest age groups, junior enlisted, and junior officers experiencing higher percentages of injuries than their counterparts (data not shown). Among alcohol-related encounters with co-occurring injury, a total of 10,120 external cause codes were recorded; slightly more than half (56.1%; n=9,714) of encounters were associated with 1 or more external cause codes (Table 4). External cause codes in the “other” category accounted for the largest proportion of injuries (15.6%), followed by falls (11.7%), assaults (10.6%), and self-inflicted injuries (10.3%). Over time, the proportion of alcohol-related encounters with co-occurring injury stayed relatively stable (data not shown), while the percentage of those encounters attributable to self-inflicted injuries and assaults decreased substantially (Figure 5).
Army service members experienced the highest percentage of alcohol-related self-inflicted injuries, while Marines experienced the highest percentage of assaults (data not shown). When intentional injuries were characterized by sex, self-inflicted injuries accounted for a higher percentage of all alcohol-related injuries in women (20.0%; n=397) than in men (9.0%; n=1,390), while assaults accounted for a higher percentage of injuries in men (11.4%; n=1,756) compared to women (3.6%; n=72). Self-inflicted injuries accounted for a higher percentage of alcohol-associated injuries in women than in men across all age categories (data not shown).
A total of 15,629 individuals had more than 1 encounter during the time period. For those service members with multiple alcohol-related encounters, the mean number of encounters was 2.3 (standard deviation: 1.8; range: 2–31). While the Army accounted for 38.0% of the total p-yrs in the study, more than half (53.7%) of encounters attributable to repeat offenders occurred within that service branch. Of the 22,714 alcohol-related encounters among this group, a larger portion of them were hospitalizations as opposed to ED visits (62.4%; n=14,183) than in the study group as a whole. Otherwise, Army service members to whom these encounters were attributable were demographically similar to the rest of the study population: they were more predominantly male (88.9%; n=20,190), in the 21–25-year-old age group (36.4%; n=8,260) or the 26–30-year-old age group (24.0%; n=5,455), and more frequently had an education level of "high school or less" (77.0%; n=17,469). Combat-specific occupations were the most common occupation type (31.7%; n=7,192) (data not shown).
Editorial Comment
This analysis is the first to characterize alcohol-related medical encounters and injuries across the entire active component. While direct comparisons are difficult, the estimated rate of alcohol-related ED visits and hospitalizations among active component service members is substantially lower than those reported in the civilian sector.4 While published estimates suggest that service members misuse alcohol at higher rates than their civilian counterparts,4,7 factors such as service members' concerns for potential negative career impact, alcohol and drug prevention programs and trainings implemented by each of the services, mandated buddy systems where service members share responsibility for each other's drinking and behavior, base restrictions on the use of alcohol, and alcohol and drug screening programs may work to limit the number of individuals who reach the level of requiring emergency medical attention.
This analysis demonstrated an overall decrease in alcohol-related encounters from 2009 through 2018. Interestingly, an increase in the rates of alcohol-related encounters in 2011 and 2012 and a subsequent decline were seen, both overall and among previous deployers. The timing of this increase in the rate of alcohol-related encounters mirrors the surge and subsequent draw-down of forces in Afghanistan. Military conflict has been shown to increase alcohol drinking behaviors,10,17 at least for finite periods of time.18 While it is not possible to causally relate the increase in the rates of alcohol-related encounters in 2011 and 2012 to the conflict in Afghanistan, it is reasonable to anticipate increases in the rates of such encounters in future potential military conflicts. The reason for the pattern of change in the rates of alcohol-related ED encounters during 2009–2012 while the rates of alcohol-related hospitalizations remained relatively stable is unclear. This could be related to a downtrend that began in years before the study period, or it may be an issue of data capture, as many EDs in the MHS transitioned from paper to electronic records around that time.
The older age groups in this study had lower rates of alcohol-related encounters in general; however, rates among those groups increased during the study period while the rates in other age categories remained steady or decreased. The increased rates are of concern and may be linked to the trend of increasing alcohol-related ED visits seen in the civilian sector among individuals aged 45 years and older. Whether this trend represents a cohort effect of heavy drinkers maintaining drinking behaviors over time, an increase in care-seeking behavior as individuals age, an impact associated with multiple deployments, or the effect of some other military or environmental exposure is unknown. Further investigation into these and other potentially contributing factors may be warranted.
Though decreasing, the trend of self-inflicted injuries in women is also concerning. It must be noted that the crude number of alcohol-related injuries in women overall and the number of those injuries that were self-inflicted were low, which makes explanation of this pattern challenging. This may be related to a larger, non-alcohol-related trend, or it could be that women are simply less likely to injure themselves in accidental ways while drinking. Certainly this is another area that deserves further investigation.
Lost productivity due to alcohol-related ED visits and hospitalizations, both in routine and mission-related duties, is difficult to quantify but concerning nonetheless. A 2007 RAND report estimated the cost to the government of 1 military p-yr to be between $58,000 and $175,000, depending on occupation, specialty pays, and other specific entitlements.19 Using the lowest estimated yearly value of $58,000 and accounting for inflation to 2014 (roughly the middle of the study period), 1 military p-yr can be estimated to cost the government just over $70,000. Under the assumption that each of the 101,554 ED encounters or inpatient hospitalizations in the last decade resulted in only 1 lost day of productivity, a little more than 278 p-yrs of time would have been lost, at a very conservative total cost estimate of around $19.5 million over the time frame. Lost duty days provide a poor estimate of impact, however, as the DoD generally does not pay for replacement staff when an active component member is absent from work, and a cost estimate does not account for the myriad of other readiness-related factors involved.
The over-representation of Army service members among those with repeat alcohol-related visits is likely related to the higher rate of alcohol-related encounters attributable to the Army in general. However, it may also suggest higher tolerance of these episodes and stronger efforts to rehabilitate soldiers and salvage careers than in the other service branches.
Some strengths and limitations of this study should be considered. The DMSS is a robust data source that allows capture of care anywhere it was rendered as long as the care is covered by TRICARE and also allows analysis of multiple demographic variables and exposures of interest. The number of active component service members who receive care in the civilian sector and use other insurance or pay out of pocket is likely low. However, it is still possible to have missed a significant number of alcohol-related encounters. The transition from ICD-9 to ICD-10 coding in 2015 creates challenges in maintaining consistent case definitions across the time frame of the study. In order to avoid capturing nonalcohol-related events or creating a false elevation in the trend of alcohol-related ED visits and hospitalizations at the time of the coding transition, some codes were intentionally omitted from the data query, which would have resulted in at least a small amount of under-counting. Moreover, there may be hesitancy in the part of clinicians treating active component members to use alcohol-related diagnosis codes because of concern of impact to the service member’s career, which would have also resulted in cases not being captured. For more than 40% of the injuries, there were no external cause codes, which is a limitation that may also be at least partly explained by clinician hesitancy to code the circumstances surrounding the injury. For the deployment history variable, there may have been undercapture of deployments among Navy service members, as this information was dependent primarily on electronic completion of the PDHA for these individuals. Additionally, given the differences in demographics and drinking patterns, this study lacks generalizability to the civilian U.S. population. Finally, while actual costs can be calculated to some degree, the difficulty in truly quantifying the impact to the DOD in terms of readiness and mission preparedness is a limitation.
Alcohol misuse contributes to significant harms among military service members and substantial costs to the U.S. Armed Forces. It also decreases readiness and force lethality. A variety of programs and policies are in place to reduce alcohol misuse in the military, including educational campaigns, required annual training, sobriety checks on military bases, and buddy systems. Still, there is room for improvement, especially as it pertains to cultural factors that promote heavy drinking and stressors related to deployment and combat exposure. Though decreasing in frequency, intentional injuries account for a concerning proportion of injuries seen here. Additional exploration into military-specific as well as socioenvironmental drivers is warranted, as are interventions aimed at further reducing this trend. Similarly, efforts to identify and capitalize on protective factors may serve to further reduce alcohol-related encounters in the military and improve preparedness of the warfighter.
Author affiliations: Department of Preventive Medicine and Biostatistics, Uniformed Services University of the Health Sciences (CDR Self); Armed Forces Health Surveillance Branch (Mrs. Oetting, CDR Clausen, Dr. Stahlman).
Disclaimer: The contents, views, or opinions expressed in this publication or presentation are those of the author(s) and do not necessarily reflect official policy or position of Uniformed Services University of the Health Sciences, the Department of Defense, or the Departments of the Army, Navy, or Air Force. Mention of trade names, commercial products, or organizations does not imply endorsement by the U.S. Government.
References
- Centers for Disease Control and Prevention. Excessive alcohol use. https://www.cdc.gov/chronicdisease/resources/publications/aag/alcohol.htm. Accessed 12 June 2020.
- Cherpitel CJ, Bond J, Ye Y, Borges G, Macdonald S, Giesbrecht N. A cross-national meta-analysis of alcohol and injury: data from the Emergency Room Collaborative Alcohol Analysis Project (ERCAAP). Addiction. 2003;98(9):1277–1286.
- World Health Organization. Alcohol. https://www.who.int/news-room/fact-sheets/detail/alcohol. Accessed 12 June 2020.
- White AM, Slater ME, Ng G, Hingson R, Breslow R. Trends in alcohol-related emergency department visits in the United States: results from the Nationwide Emergency Department Sample, 2006 to 2014. Alcohol Clin Exp Res. 2018;42(2):352–359.
- White A, Castle I, Chen C, Shirley M, Roach D, Hingson R. Converging Patterns of Alcohol Use and Related Outcomes Among Females and Males in the United States, 2002 to 2012. Alcohol Clin Exp Res. 2015;39(9):1712–1726.
- Slade T, Chapman C, Swift W, Keyes K, Tonks Z, Teesson M. Birth cohort trends in the global epidemiology of alcohol use and alcohol-related harms in men and women: systematic review and metaregression. BMJ Open. 2016;6(10):e011827.
- Meadows SO, Engel CC, Collins RL, et al. 2015 Department of Defense Health Related Behaviors Survey (HRBS). Rand Health Q. 2018;8(2):5.
- Barry AE, Stellefson ML, Hanik B, et al. Examining the association between binge drinking and propensity to join the military. Mil Med. 2013;178(1):37–42.
- Shirvani M, Reed MB, Clingan S. The relationship relationship between emerging adult alcohol consumption and military enlistment. Mil Med. 2017;182(9):e1731–e1737.
- Bray RM, Brown JM, Williams J. Trends in binge and heavy drinking, alcohol-related problems, and combat exposure in the U.S. military. Subst Use Misuse. 2013;48(10):799–810.
- Mustillo SA, Kysar-Moon A, Douglas SR, et al. Overview of depression, post-traumatic stress disorder, and alcohol misuse among active duty service members returning from Iraq and Afghanistan, self-report and diagnosis. Mil Med. 2015;180(4):419–427.
- Taylor JE, Haddock K, Carlos Poston WS, Talcott WG. Relationship between patterns of alcohol use and negative alcohol-related outcomes among U.S. Air Force recruits. Mil Med. 2007;172(4):379–382.
- Rossen LM, Pollack KM, Canham-Chervak M, Canada S, Baker SP. Motor vehicle crashes among active duty U.S. Army personnel, 1999 to 2006. Mil Med. 2011;176(9):1019–1026.
- Sacks JJ, Gonzales KR, Bouchery EE, Tomedi LE, Brewer RD. 2010 National and state costs of excessive alcohol consumption. Am J Prev Med. 2015;49(5):e73–e79.
- Dall TM, Zhang Y, Chen YJ, et al. Cost associated with being overweight and with obesity, high alcohol consumption, and tobacco use within the Military Health System's TRICARE prime-enrolled population. Am J Health Promot. 2007;22(2):120–139.
- Li T, Waters TM, Kaplan EK, et al. Economic analyses of an alcohol misconduct prevention program in a military setting. Mil Med. 2017;182(1):e1526–e1567.
- Jacobson IG, Ryan MAK, Hooper TI, et al. Alcohol use and alcohol-related problems before and after military combat. JAMA. 2008;300(6):663–675.
- Fink DS, Keyes KM, Calabrese JR, et al. Deployment and alcohol use in a military cohort: use of combined methods to account for exposure related covariates and heterogeneous response to exposure. Am J Epidemiol. 2017;186(4):411–419.
- Dahlman C. The Cost of a Military Person-Year. A Method for Computing Savings from Force Reductions. Santa Monica, CA: RAND National Defense Research Institute; 2007.