Abstract
Laboratory-based respiratory pathogen surveillance for SARS-CoV-2 and other respiratory pathogens was conducted in the 2020–2021 surveillance season among U.S. Military Health System (MHS) beneficiaries through the Department of Defense Global Respiratory Pathogen Surveillance Program (DoDGRPSP). Sentinel and participating sites submitted 96,660 specimens for clinical diagnostic testing. A total of 12,282 SARS-CoV-2 positive cases were identified, and 7,286 of the associated viruses were successfully sequenced. Two overlapping waves of SARS-CoV-2 activity were observed during the season. The B.1.1.7 (Alpha) lineage was dominant during February 2021 through May 2021. By July 2021, and continuing through the rest of the season, B.1.617.2/AY.x (Delta) lineage predominated and by September 2021 comprised 100% of identified SARS-CoV-2 lineages. The emergence of SARS-CoV-2 coincided with substantial reductions in the circulation of seasonal influenza viruses and most other non-SARS-CoV-2 respiratory pathogens. A total of 4,426 non-SARS-CoV-2 respiratory pathogens were identified, including 71 influenza. Of the 71 influenza positives, 64 were successfully sequenced. The majority of influenza strains sequenced belonged to influenza A(H3N2) clades 3C.2a1b.2a2. The most common non-SARSCoV-2 respiratory pathogen detected was rhinovirus/enterovirus (3,058).
What are the new findings?
DoDGRPSP data show that B.1.1.7 (Alpha) lineage was dominant during February 2021 through May 2021. B.1.617.2/AY.x (Delta) was the predominant lineage from July 2021 through September 2021. The emergence of SARSCoV-2 corresponded with substantial reductions to the circulation of most other respiratory pathogens, including the influenza virus, among MHS beneficiaries.
What is the impact on readiness and force health protection?
As SARS-CoV-2 cases continue to fluctuate, sequencing is crucial to characterize the diversity of variants impacting MHS beneficiaries. Additionally, as recent focus has shifted to SARS-CoV-2 detection, testing for other respiratory pathogens should still be performed in patients presenting with respiratory symptoms for the effective surveillance of other respiratory pathogens within the MHS. Such continued surveillance will enable installations to rapidly identify, control, and prevent further spread of respiratory pathogens in their communities and provide optimal treatment for MHS beneficiaries.
Background
Respiratory pathogens, such as influenza and adenovirus, have been the main focus of the Department of Defense Global Respiratory Pathogen Surveillance Program (DoDGRPSP) since 1976.1 However, DoDGRPSP also began focusing on SARS-CoV-2 when COVID-19 was declared a pandemic illness in early March 2020.2 Following this declaration, the DoD quickly adapted and organized its respiratory surveillance program, housed at the U.S. Air Force School of Aerospace Medicine (USAFSAM), in response to this emergent virus. The DoDGRPSP began to track the incidences of COVID-19-like illness (CLI) or influenza-like illness (ILI) trends and provided data to the Centers for Disease Control and Prevention (CDC) and reported identified SARS-CoV-2 isolates among its beneficiaries. This report provides an overview of DoDGRPSP in addition to summarizing SARS-CoV-2 and other respiratory pathogen activity during the 2020–2021 surveillance season.
Methods
Surveillance population
The Defense Health Agency/Armed Forces Health Surveillance Division–Air Force Satellite Cell (DHA/AFHSD–AF) and USAFSAM manage the surveillance program that includes 102 sentinel sites and many non-sentinel sites. DoDGRPSP requests that sentinel sites submit 6–10 respiratory specimens per week from U.S. Military Health System (MHS) beneficiaries who meet the CLI or ILI case definition. CLI or ILI were defined as the presence of a fever ≥100.4°F (≥38°C oral or equivalent) and cough, and 3 or more of the following symptoms: shortness of breath, chills, fatigue, body aches, headache, loss of taste/smell, sore throat, sinus congestion, runny nose, vomiting, chills with shaking, and diarrhea3 within 72 hours of symptoms onset. Demographic information for patients was collected through a self-reported questionnaire, the Composite Health Care System (CHCS), the Defense Enrollment Eligibility Reporting System (DEERS) and the Armed Forces Health Longitudinal Technology Application (AHLTA). Any specimens that the laboratory cancelled, rejected, did not test, or returned as an inconclusive test result were not included in the final study population.
Laboratory testing
Two laboratories processed the specimens: Landstuhl Regional Medical Center (LRMC) for all the U.S. European Command (EUCOM) and USAFSAM for all other locations. Non-SARS-CoV-2 respiratory pathogen selection and testing have been previously described.1,4,5 SARS-CoV-2 testing was done through Real-Time Reverse Transcription Polymerase Chain Reaction amplification (RT-PCR, Cobas 8800 system, Roche Diagnostics or Thermo TaqPath COVID-19 Combo Kit) at USAFSAM or the Cepheid GeneXpert Xpress Flu/RSV (Flu/RSV/FluA-B), Luminex or BioFire at LRMC. Respiratory specimens were collected by nasal wash or nasopharyngeal swab and transported at -70°C. All tests were performed in accordance with the protocols available provided by the CDC and manufacturer's instructions for use. The laboratory-confirmed positive specimens for SARS-CoV-2 or influenza viruses were further genetically characterized via Illumina next-generation sequencing (NGS) technology and analyzed using the Cecret pipeline6 and Pango7 for SARSCoV-2 and the CDC Iterative Refinement Meta-Assembler (IRMA) package8, BioEdit software9, and components of the DNASTAR Lasergene Core Suite10 for influenza.
Statistical analysis
Data analysis was performed using SAS version 9.4 (2014, SAS Institute, Cary, NC). A p-value of <0.05 was considered statistically significant. Baseline characteristics of all pathogen detections were summarized by the frequency of specimens collected, number tested and the test positivity. The trends in positivity rate over time for both SARS-CoV-2 and non-SARS-CoV-2 respiratory pathogens were described by calculating the 14-day rolling average. Comparisons of the demographic characteristics (sex, age group, month of illness, and geographical combatant commands) and the clinical findings (patient symptoms) among the groups were performed using a chi-square or Fisher’s exact test for categorical variables and a t test for continuous variables. Symptom evaluation was limited to those specimens with associated DoDGRPSP questionnaires.
Results
SARS-CoV-2 and other respiratory pathogens surveillance
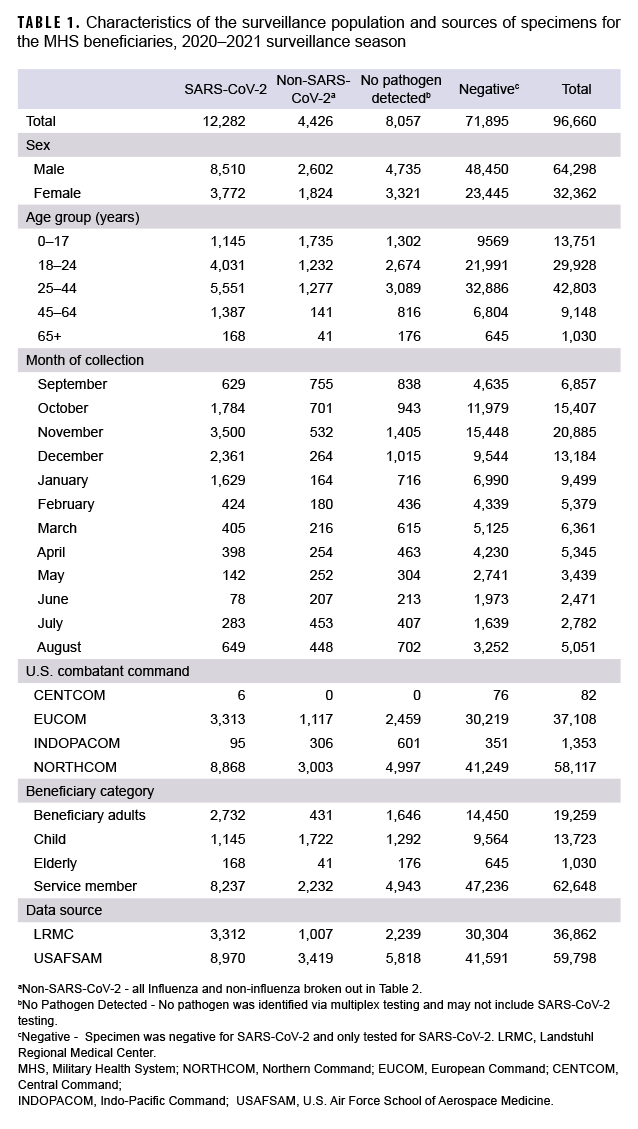
From 27 September 2020 through 2 October 2021, a total of 96,660 specimens were collected (Table 1). The majority of specimens (61.0%) were collected and tested in the months of October through January, reflecting the most laboratory positive SARS-CoV-2 cases identified in the same months (75.5%). The most confirmed non-SARS-CoV-2 positive cases were in September, October and November. By comparison, more non-SARS-CoV-2 respiratory pathogens were confirmed in the 2 prior seasons.1,5 A declining trend was observed for SARS-CoV-2 during the months of February 2021 through June 2021 (Table 1). Of the specimens tested, 64,298 (66.5%) were from male beneficiaries and 32,362 (33.5%) were from female beneficiaries. Additionally, 62,648 (64.8%) were from service members, 19,259 (19.9%) were from beneficiary adults (18–64 years), 13,723 (14.2%) were from children (0–17 years) and 1,030 (1.1%) were from seniors (65+ years). The largest share of the specimens came from beneficiaries aged 25–44 (44.3%; n=42,803). In this group, there were 5,551 positive specimens for SARS-CoV-2 and 1,277 positive for other respiratory pathogens. Additionally, the beneficiaries aged 0–17 had more specimens positive for non-SARS-CoV-2 respiratory pathogens than those in any other age group (Table 1).
The collected specimens varied widely by the 4 geographical combatant commands. The U.S Northern Command (NORTHCOM) contributed 58,117 (60.1%) specimens, with 8,868 positive for SARS-CoV-2 and 3,003 positive for non- SARS-CoV-2 pathogens. The U.S European Command (EUCOM) contributed 37,108 (38.4%) specimens of which 3,313 were positive for SARS-CoV-2 and 1,117 were positive for other pathogens. The U.S Indo-Pacific Command (INDOPACOM) and U.S Central Command (CENTCOM) contributed 1,353 (1.4%) and 82 (0.08%) specimens, respectively.
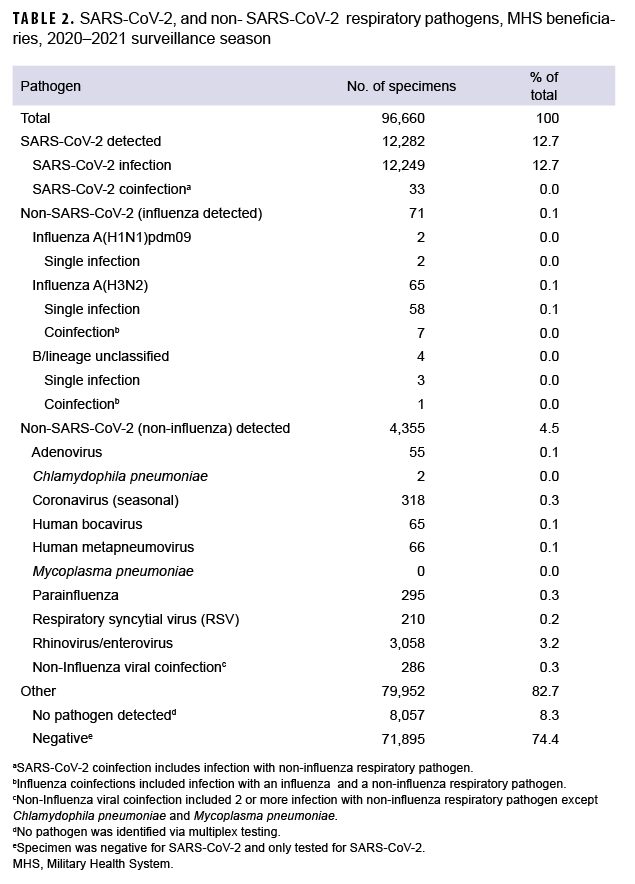
To understand the distribution, dynamics and clinical profile of SARS-CoV-2 and non-SARS-CoV-2 respiratory pathogen transmission during the surveillance season, a detailed analysis of the data was performed. Among the 4,426 non-SARSCoV-2 respiratory pathogens detected, 65 were positive for influenza A(H3N2) including 7 coinfections, 4 of which were positive for influenza B viruses with no lineage classification including 1 coinfection, and 2 were positive for influenza A(H1N1) pdm09 (Table 2).
The most common non- SARS-CoV-2 respiratory pathogen was rhinovirus/ enterovirus (3,312), including 254 specimens positive for rhinovirus/enterovirus and another non-influenza virus (data not shown). The respiratory pathogen panel includes tests for only 2 bacterial pathogens: Mycoplasma pneumoniae and Chlamydophila pneumoniae. M. pneumoniae was not detected; however, 2 specimens were confirmed positive for C. pneumoniae as compared to 60 in the prior season.5
Overall, 12,282 specimens were positive for SARS-CoV-2 including 33 coinfections. These mixed infections included: 3 adenovirus, 2 coronavirus (seasonal), 2 RSV, 4 human metapneumovirus, 19 rhinovirus/enterovirus, 1 human bocavirus, 1 adenovirus and parainfluenza (triple coinfection) and 1 human metapneumovirus, parainfluenza and rhinovirus/enterovirus (quadruple coinfection).
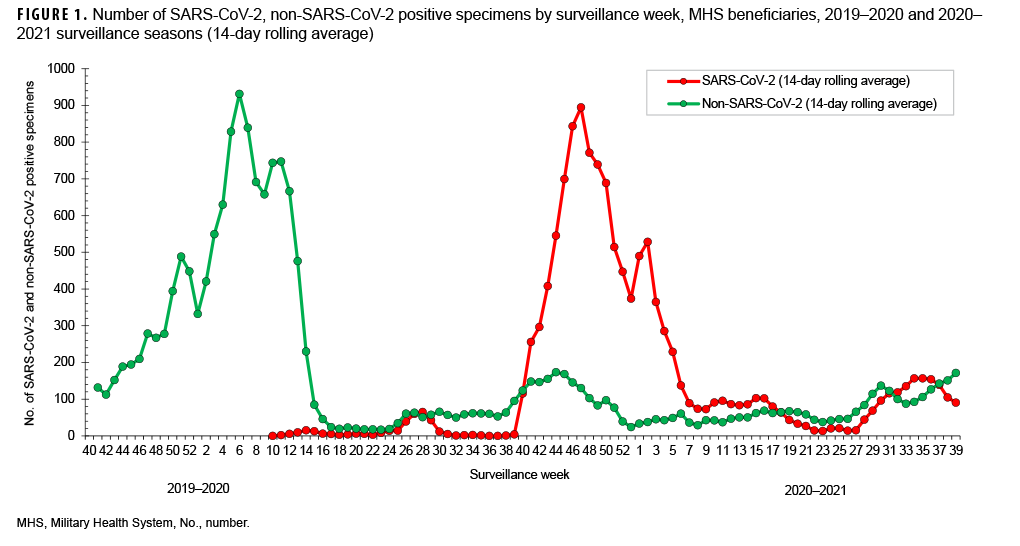
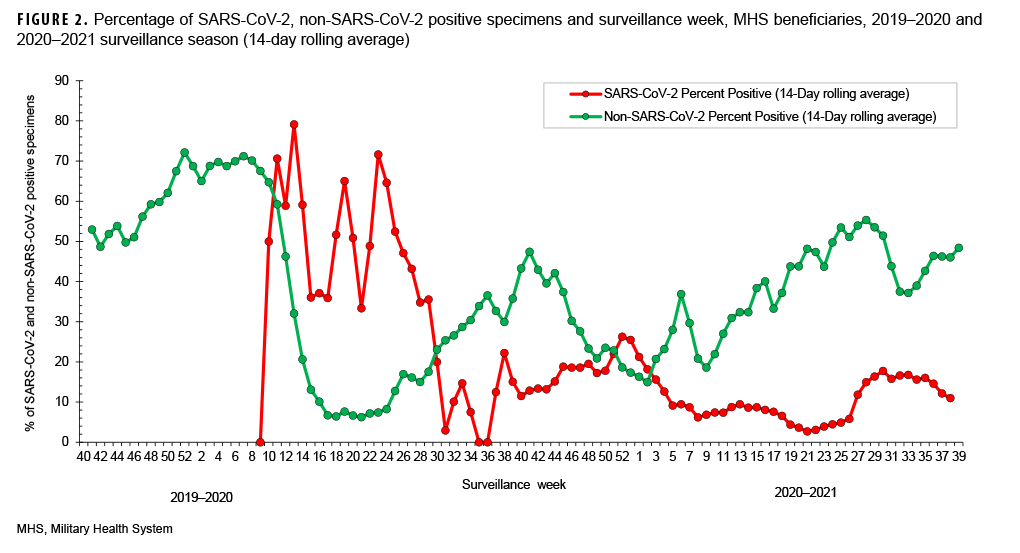
SARS-CoV-2 testing began during week 10 (March 2020) of the 2019–2020 surveillance season (Figures 1, 2). This is the same month that a national public health emergency was issued in response to SARSCoV- 2 pandemic by the U. S. government.11 Subsequent declines in the number of non- SARS-CoV-2 respiratory pathogens and percent positivity likely resulted, at least in part, from non-pharmaceutical interventions implemented worldwide. (Figures 1, 2).
During the 2019–2020 season, the percent positivity rates for SARS-CoV-2 began to decrease in surveillance week 28 through week 34 (July–August 2020) and continued to decrease to near 0 in week 36 through week 37 (September 2020), before a relative increase in week 38 through week 39 (September 2020) of the surveillance year. A similar pattern was observed in the Health and Human Services Regions of the U.S., although, there was variability in some of the regions.14 Peak SARS-CoV-2 activity occurred during weeks 40 through 4 (September 2020–January 2021) (Figure 1). Thereafter, the weekly detections steadily decreased until week 27 (June 2021) (Figure1).
However, starting surveillance week 28 and continuing through week 33 (July–August 2021), an increasing trend was observed with the emergence of the Delta variant in the summer which may have been due to the virus’s increased transmissibility and immune evasion.15 The trend began to decrease after week 35, perhaps due to improved vaccination coverage in beneficiaries.
The percent positivity for non-SARSCoV-2 respiratory pathogens was higher compared to the SARS-CoV-2 virus during the 2020–2021 surveillance season. Of note, the percent positives for SARS-CoV-2 and non-SARS-CoV-2 during the 2020–2021 surveillance season ranged from 3% to 26% and 15% to 55%, respectively (Figure 2). It is unclear what factors may have contributed to the apparent change in the relative frequencies of identification of SARS-CoV-2 compared to the other usual potential respiratory pathogens.
Genetic characteristics of SARS-CoV-2 and influenza virus
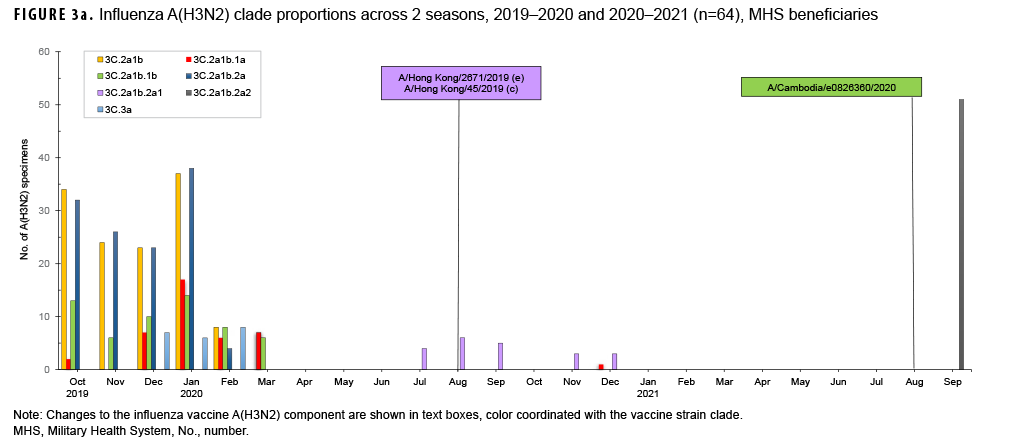
For the period from 4 October 2020 through 3 October 2021, USAFSAM conducted next-generation sequencing and analysis on both influenza positive and SARS-CoV-2 positive specimens with the help of its partners, the Navy Medical Research Unit 2 (NAMRU-2) in Cambodia and the Armed Forces Research of Medical Sciences (AFRIMS) in Thailand. In total, 64 of 71 influenza specimens were successfully sequenced and analyzed. Among those, 63 were influenza A(H3N2) with 11 clade 3C.2a1b.2a1 (17.5%) specimens collected from Cambodia and Thailand between September 2020 and December 2020, one clade 3C.2a1b.1a (1.6%) specimen collected from the Philippines in December 2020, and 51 clade 3C.2a1b.2a2 (80.9%) specimens collected from Germany and Maryland in September 2021 (Figure 3a). One influenza A(H1N1) pdm09 specimen from North Dakota was identified as being of swine origin and had hemagglutinin (HA) and neuraminidase (NA) genes that closely resembled human origin A(H1N1) viruses.
However, the internal gene segments closely resembled swine origin A(H1N1) viruses. This specimen, designated as an influenza A(H1N1) variant, or A(H1N1)v, was collected from a 5 year old patient who had visited a state fair, and had contact with livestock, 3 days prior to symptom onset and specimen collection. No further cases of this influenza variant were detected, suggesting the absence of human-to-human transmission.
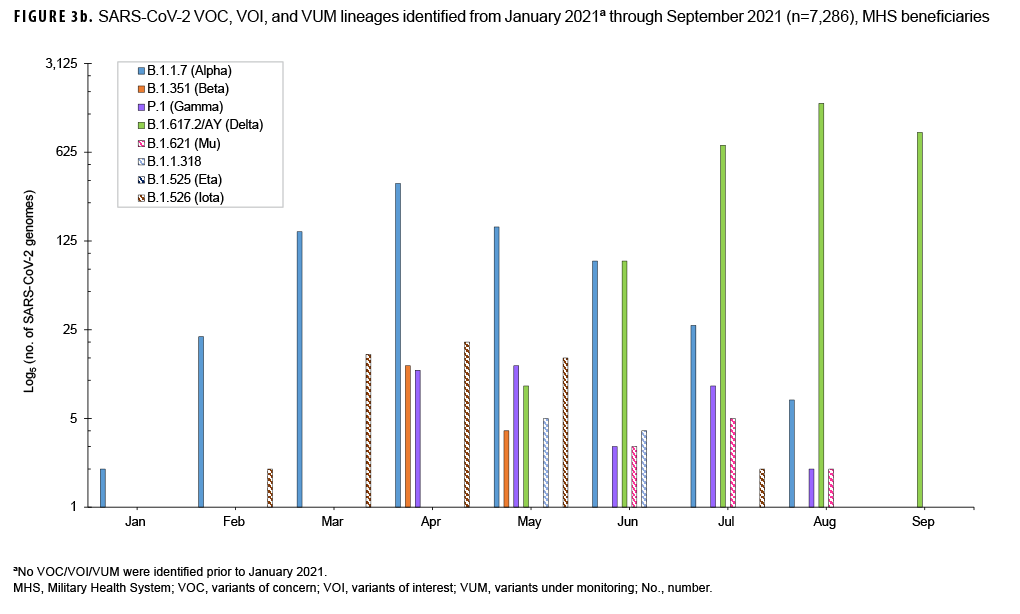
In addition, 7,286 out of 12,282 SARSCoV-2 positive specimens were sequenced, analyzed and 5,070 were assigned to PANGO lineages. As of December 2020, the World Health Organization (WHO) characterized genetic variants under the classifications Variants of Concern (VOC), Variants of Interest (VOI), and Variants under Monitoring (VUM). The VOC identified included 809 B.1.1.7 (Alpha), 18 B.1.351 (Beta), 41 P.1 (Gamma), and 3,237 B.1.617.2/AY (Delta). The VOI included 11 B.1.621 (Mu). The VUM included nine B.1.1.318, two B.1.525 (Eta), and 56 B.1.526 (Iota) (Figure 3b).
SARS-CoV-2 infection analysis
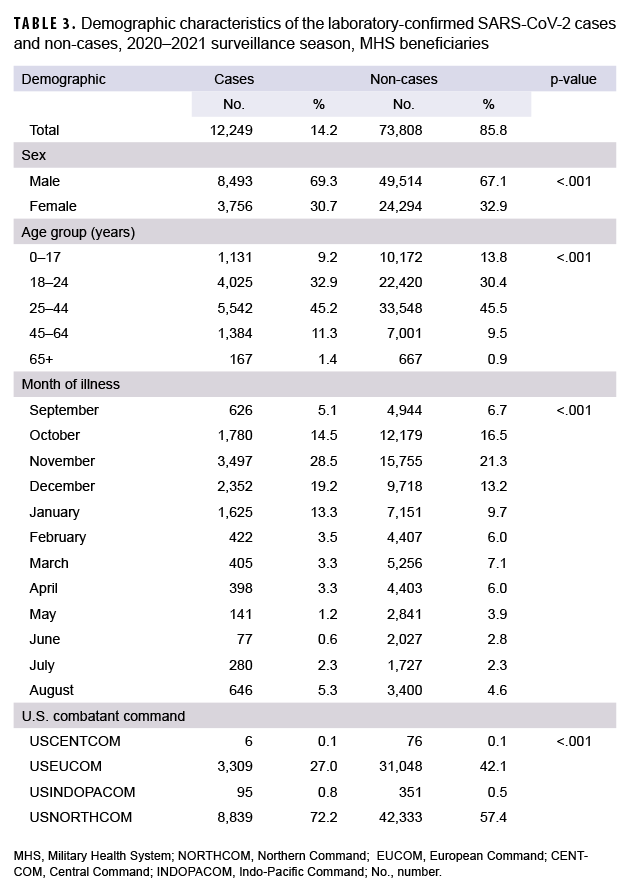
Data were limited to specimens that were tested for SARS-CoV-2 virus without coinfections and those that submitted a DoDGRPSP questionnaire. There were 86,057 specimens tested for SARS-CoV-2, of which 12,249 were positive and classified as cases; 73,808 were negative and classified as non-cases (Table 3). Male beneficiaries made up 8,493 (69.3%) of the cases and 49,514 (67.1%) of the non-cases. Female beneficiaries made up 3,756 (30.7%) of the cases and 24,294 (32.9%) of the non-cases. In addition, when comparing the proportions of cases to non-cases, statistically significant differences were observed for the following demographic characteristics: sex, age, month of illness, and geographical combatant commands (Table 3).
Symptomatic evaluation was further limited to those with a DoDGRPSP questionnaire and who met the case definition criteria. Among the 86,057 specimens tested for SARS-CoV-2, 1,306 specimens had DoDGRPSP questionnaires (Table 4). Univariate analysis showed that out of the 14 symptoms evaluated, 10 had statistically significant differences between the cases and the non-cases (p<.05). The most common symptoms among the confirmed cases were cough (75.4%), sinus congestion (66.3%), headache (64.9%), and body aches (57.3%). Additionally, cough (59.6%), sinus congestion (55.5%) and headache (55.6%) were the most frequent symptoms observed in the non-cases, aside from sore throat (55.9%). The odds ratios calculated ranged from 0.80 (shortness of breath; 95%CI: 0.51–1.25) to 3.31 (change in sense of taste/smell; 95%CI: 2.31–4.74). The cases and non-cases did not differ significantly by the following symptoms: runny nose, shortness of breath, sore throat, and fatigue (p>.05) (Table 4).
Editorial Comment
The 2020–2021 season showed low non-SARS-CoV-2 respiratory pathogen activity. The predominant non-SARSCoV-2 pathogen circulating during the 2020–2021 surveillance season was rhinovirus/enterovirus. Only 0.6% of non-SARS-CoV-2 respiratory specimens tested by the DoDGRPSP were positive for influenza viruses as compared with 19.6% in the 2019–2020 season.5 Among the 71 confirmed cases of influenza, the majority were attributed to an outbreak at the U.S. Naval Academy in Annapolis, Maryland in September 2021. Overall, these numbers are substantially lower than those reported in 2019-2020,5 contributing to an unprecedented 2020-2021 surveillance season for non-SARS-CoV-2 pathogens. Beginning in December 2020, the WHO began characterizing SARS-CoV-2 lineages as VOC and VOI, and later added the category VUM.16 Two overlapping waves of SARS-CoV-2 variant activity were observed throughout the 2020-2021 season.
The B.1.1.7 (Alpha) lineage predominated February 2021 through May 2021. By July 2021, and continuing through the rest of the season, B.1.617.2/AY.x (Delta) predominated and by September 2021 made up 100% of the identified SARS-CoV-2 lineages. Other VOC, VOI and VUM were also observed, but in much smaller proportions (Figure 3b). The rapid shift in SARSCoV-2 genetic diversity within a single surveillance season emphasizes the need for continued sequence surveillance of new and emerging SARS-CoV-2 variants. As more studies continue to elucidate the impact of the COVID-19 pandemic on MHS beneficiaries,17 surveillance of all respiratory pathogens is imperative in order to document changes in incidences of other diseases aside from COVID-19. Enhanced patient management and treatment, while reducing the time patients are in isolation, particularly for those infected with other common respiratory pathogen, is of extreme importance.
The findings in this study are subject to at least three limitations. First, if multiple specimens were submitted from an individual, only one specimen was retained in order to prevent duplication. If multiple specimens were submitted from a single individual, the first positive test result was recorded or in the case of all negative results, the first negative result was recorded. Second, the self-reporting nature of some of our data, specifically the symptoms, could have affected the statistical significance in the analysis because, it could have been underestimated or overestimated during the time of recall.
Third, the low submission rate of the DoDGRPSP questionnaires reduced the amount of CLI or ILI information available for analysis. This low submission may be attributed to the nonpharmaceutical measures implemented across the installations such as distancing and limiting contact time. Nevertheless, all specimens submitted to the program are requested to meet the CLI or ILI criteria; however, physician diagnosed specimens were accepted (the patient did not meet the CLI/ILI criteria, but testing was determined necessary by the physician). Those without a questionnaire were assumed to be physician diagnosed specimens.
Although strong interventions were in place to prevent and contain the spread of the SARS-CoV-2 pandemic within the MHS, more work is needed to determine if those interventions effectively delayed the spread of SARS-CoV-2 virus. This report analyzed the epidemiological trends of SARS-CoV-2 and non-SARSCoV-2 respiratory pathogens and found a high infection rate of both SARS-CoV-2 and non-SARS-CoV-2 in patients presenting with CLI or ILI. Although the current pandemic constitutes a serious public health concern, many other pathogens cause respiratory tract infections among the MHS beneficiaries. Therefore, continued testing of those with respiratory symptoms using a multiplex PCR assay is the most effective means for surveillance and to identify the transmission patterns within MHS beneficiaries for optimal treatment and to inhibit the rapid spread of all respiratory pathogens.
Author affiliations
Defense Health Agency/Armed Forces Health Surveillance Division Air Force Satellite–U.S. Air Force School of Aerospace Medicine, Wright-Patterson Air Force Base, OH (Mr. Kwaah, Ms. DeMarcus, Mr. Thervil, Dr. Sjoberg, Lt Col Robbins); JYG Innovations, LLC, Dayton, OH (Mr. Kwaah, Mr. Gruner, Ms. DeMarcus, Mr. Thervil, Dr. Sjoberg, Dr. Muehleman); U.S. Air Force School of Aerospace Medicine epidemiology laboratory, Wright-Patterson Air Force Base, OH (Mr. Gruner, Dr. Fries, Dr. Muehleman). Landstuhl Regional Medical Center Department of Pathology and Area Laboratory Services, Germany (Mr. Castillo).
Acknowledgments
The authors would like to thank the Department of Defense Global Respiratory Pathogen Surveillance Program sentinel partners, partner, the U.S. Air Force School of Aerospace Medicine Epidemiology laboratory, the Navy Medical Research Unit 2 in Cambodia (Vireak Heang) and the Armed Forces Research Institute of Medical Sciences in Thailand (Chonticha Klungthong, Piyawan Chinnawirotpisan, Thipwipha Phonpakobsin, Kittinun Hussem, Wudtichai Manasatienkij) for their valuable contributions to this work.
Disclaimer
This study was funded by the Global Emerging Infections Surveillance (GEIS) Branch, Armed Forces Health Surveillance Division (AFHSD), ProMIS ID: P0096_21_US. The views expressed are those of the authors and do not reflect the official guidance or position of the United States Government, the Department of Defense, or of the United States Air Force.
References
1. Kersellius GD, Gruner WE, Fries AC, DeMarcus LS, Robbins AS. Respiratory pathogen surveillance trends and influenza vaccine effectiveness estimates for the 2018–2019 season among Department of Defense beneficiaries. MSMR. 2020;27(1):17–23.
2. The World Health Organization. Director-General's opening remarks at the media briefing on. COVID-19 -11 March 2020. Accessed 11 September 2021. https://www.who.int/directorgeneral/speeches/detail/who-director-general-sopening-remarks-at-the-media-briefing-on-covid-19---11-march-2020
3. The World Health Organization. Public health surveillance for COVID-19: Interim guidance. Accessed 11 September 2021. https://www.who.int/publications/i/item/who-2019-nCoV-surveillanceguidance-2020.8
4. DeMarcus LS, Shoubaki L, Federinko S. Comparing influenza vaccine effectiveness between cell-derived and egg-derived vaccines, 2017–2018 influenza season. Vaccine. 2019; 37(30):4015–4021.
5. Hu W, Gruner WE, DeMarcus LS, et al. Influenza Surveillance Trends and Influenza Vaccine Effectiveness Among Department of Defense Beneficiaries During the 2019–2020 Influenza Season; MSMR. 2021;28(3):2–8.
6. Young, EL. Technical Outreach and Assistance for States Team 2021. Cecret Workflow for SARSCoV-2 Assembly and Lineage Classification. Accessed 8 December 2021.https://www.protocols.io/view/cecret-workflow-for-sars-cov-2-assembly-and-lineag-by72pzqe.
7. O’Toole A, Scher E, Underwood A, et al. Assignment of epidemiological lineages in an emerging pandemic using the pangolin tool. Virus Evolution. 2021;07(2):veab064.
8. Shepard SS, Meno S, Bahl, J, et al. Viral deep sequencing needs an adaptive approach: IRMA, the iterative refinement meta-assembler. BMC Genomics 2016;17(1):708.
9. Hall TA. BioEdit: a user-friendly biological sequence alignment editor and analysis program for Windows 95/98/NT. Nucl Acids Symp Ser.1999;41:95–98.
10. DNASTAR: Lasergene Core Suite (RRID:SCR_000291).
11. National Archives and Records Administration. Accessed on 3 January, 2022. hhttps://trumpwhitehouse.archives.gov/presidential-actions/proclamation-declaring-national-emergency-concerningnovel-coronavirus-disease-covid-19-outbreak/
12. Lyu W, Wehby GL. Community Use Of Face Masks And COVID-19: Evidence From A Natural Experiment Of State Mandates In The US. Health Aff (Millwood). 2020;39(8):1419–1425.
13. Al Jazeera News. Which countries have made wearing face masks compulsory? Accessed 15 February 2022. hhttps://www.aljazeera.com/news/2020/8/17/which-countries-have-madewearing-face-masks-compulsory
14. Center for Disease Control and Prevention. A weekly surveillance summary of U.S.COVID-19 activity for 2020-2021 season. Accessed 8 December 2021. https://www.cdc.gov/coronavirus/2019-ncov/covid-data/covidview/past-reports/08282020.html
15. Bushman M, Kahn R, et al. Population impact of SARS-CoV-2 variants with enhanced transmissibility and/or partial immune escape. Cell. 2021;184(26):6229–6242.
16. Mullen JL, Tsueng G, Latif AA, et al. The Center for Viral Systems Biology outbreak.info. Accessed 4 November 2021. https://outbreak.info/
17. Richard SA, Pollett SD, et al. COVID-19 Outcomes Among US Military Health System Beneficiaries Include Complications Across Multiple Organ Systems and Substantial Functional Impairment; Open Forum Infectious Diseases. 2021:8(12):ofab556.
18. World Health Organization. Recommended composition of the influenza virus vaccines for use in the 2021-2022 northern hemisphere influenza season. Accessed 4 November 2021.https://cdn.who.int/media/docs/defaultsource/influenza/202102_recommendation.pdf?sfvrsn=8639f6be_3&download=true