ABSTRACT
This study evaluated trends in the prevalence of overweight, obesity, and diabetes among active component service members between 2018 and 2021, before and after the start of the COVID-19 pandemic. This study also investigated the incidence of prediabetes and type 2 diabetes mellitus (T2DM) diagnoses during the same period. Between 2018 and 2021, the prevalence of obesity among active component service members who completed a Periodic Health Assessment (PHA) increased from 16.1% to 18.8%. The incidence of prediabetes increased from 588.2 to 763.8 cases per 100,000 person-years (p-yrs), and the incidence of T2DM increased from 55.5 to 69.6 per 100,000 p-yrs. The largest relative increases in obesity prevalence were in the youngest (<30 years) age categories. Navy members and Hispanic service members experienced the largest absolute and relative increases in rates of new diabetes diagnoses. These findings indicate that during the COVID-19 pandemic active component service members experienced increased prevalence of obesity, prediabetes, and diabetes. Evaluation of lifestyle factors associated with these chronic diseases among service members may be useful to enhance deployment readiness and operational effectiveness.
What are the new findings?
Between 2018 and 2021, the prevalence of obesity, prediabetes, and diabetes increased among active component service members. The largest relative increases in obesity prevalence were in the youngest (<30 years) age categories. Navy members and Hispanic service members experienced the largest absolute and relative increases in rates of new diabetes diagnoses.
What is the impact on readiness and force health protection?
The COVID-19 pandemic was accompanied by increasing obesity and overweight prevalence and increasing incidence of diabetes and prediabetes among active component service members. These largely preventable health conditions can adversely affect military recruitment, retention, and readiness. The military services need to increase their emphasis on lifestyle modification to enhance health maintenance, wellness, and general readiness optimization among service members.
BACKGROUND
The COVID-19 pandemic has resulted in over 1,077,300 deaths in the U.S., from the start of the pandemic in 2020 through November 2022.1 COVID-19 was the third leading cause of death in the U.S., after heart disease and cancer, from 2020 to 2021.2 The pandemic profoundly disrupted everyday life for many people, altering their nutrition, sleep, physical activity, stress management, and social networks. The U.S. Centers for Disease Control and Prevention (CDC) found that elevated body mass index (BMI) and a history of diabetes were associated with an increased risk for severe COVID-19 illness and death.3 Additionally, obesity is associated with an increased risk of chronic disease, including diabetes and all-cause mortality.4
Prior to the COVID-19 pandemic in the U.S., prevalence rates of overweight and obesity diagnoses were already rapidly trending in an upward direction. In 2008, 33.7% of adults in the U.S. were obese, and by 2018 that proportion had increased to 42.4%.5 Furthermore, the rising number of adults in the U.S. who were severely obese (BMI=40) represented 5.7% of the American population in 2008 and had climbed to 9.2% by 2018.5 In the 2 years since the start of the pandemic, several studies have indicated continued increases in overweight and obesity diagnoses, particularly in children and adolescents.6-8 These trends are concerning, as overweight and obesity are established risk factors for several chronic diseases including prediabetes, type 2 diabetes, hypertension, heart disease, stroke, sleep apnea, metabolic syndrome, fatty liver diseases, osteoarthritis, kidney disease, gallbladder disease, and multiple types of cancer.9
Currently, more than 37 million Americans are estimated to have diabetes, the vast majority (90-95%) type 2 diabetes mellitus (T2DM).10 Although the incidence of new diabetes diagnoses decreased among U.S. adults from 2008 to 2019, rates of newly diagnosed T2DM increased in children and adolescents between 2002 and 201511; 1 study in Alabama found significant increases in monthly new-onset pediatric T2DM during the pandemic.12 Of further concern, an estimated 96 million U.S. adults (38% of the U.S. population) were diagnosed with prediabetes or elevated fasting blood glucose in 2019.13
The U.S. military recruits new service members from young, healthy members of the U.S. population. An estimated 25% of young people aged 17 to 24, however, have elevated BMIs that disqualify them from the U.S. military.14 Preexisting chronic medical conditions including diabetes also affect the services’ ability to recruit and retain able-bodied forces.14 One study found that active duty soldiers with elevated BMIs were 47% more likely to experience a musculoskeletal injury and utilized health care at a 49% higher rate.15 Chronic injuries can not only affect service members’ capacities for continued qualification for deployment, but can also pose greater health risks and threaten the mission during service member deployment. A qualitative systematic review of militaries over 2 decades found strong scientific evidence for obesity as a modifiable risk factor for musculoskeletal injury.15
The COVID-19 pandemic began in January 2020 and rapidly began to affect almost all aspects of daily life. Pandemic effects included closures of workplaces and community infrastructures such as schools, daycare facilities, gyms, churches, restaurants, and other public spaces. New laws and cultural norms dictated that individuals were to avoid direct contact and remain distanced from other people who were potentially infected, and to wear masks in most social settings. Service members were likewise affected but also carried additional burdens of prolonged quarantine periods and frequent testing, as commanders were pressed to meet overseas mission requirements in a degraded operational environment.
The objective of this study was to evaluate the prevalence of overweight and obesity among active component service members between 2018 and 2021, before and after the start of the COVID-19 pandemic. This study also investigated the incidence of prediabetes and T2DM diagnoses during the same period.
METHODS
The study population included all active component U.S. military service members in the Army, Navy, Air Force, and Marine Corps. Periodic Health Assessment (PHA), medical encounter, and demographic data were obtained from the Defense Medical Surveillance System (DMSS), the central repository of medical surveillance data for the U.S. Armed Forces. Service members are required to complete PHAs on an annual basis. Diagnoses of diabetes mellitus and elevated blood glucose levels were ascertained from the DMSS, which includes records of inpatient and outpatient encounters at clinics and hospitals within the Military Health System (MHS), as well as civilian sources of health care reimbursed by TRICARE, the uniformed services health care program. To calculate BMI, records of height and weight were obtained from electronic PHA documentation.
Service members were included in the overweight and obesity analysis if they completed an electronic PHA between 1 January 2018 and 31 December 2021. Women with a pregnancy or birth-related diagnosis (International Classification of Diseases, 10th Revision [ICD-10] code beginning with ‘O’) in any diagnostic position in an inpatient or outpatient record within 9 months, before or after the date of their weight measurement, were excluded from the analysis. One weight measurement was included for each service member per year; if multiple weight measurement records were available from the same year, the last recorded weight measurement of the year was used. Height (recorded in inches) and weight (recorded in pounds) were used to calculate BMI using the formula: weight (lbs.) x 703 / [height (in.)2].17 A service member with a BMI=30 was classified as obese, and a service member with BMI=25 was classified as overweight. Records of weight less than 40 lbs. or greater than 370 lbs., height less than 30 in. or greater than 100 in., or BMI less than 12 or greater than 45 were excluded, as these measurements were assumed to be data entry errors.
Cases of elevated blood glucose (“prediabetes”) were defined by an outpatient medical encounter with an elevated blood glucose diagnosis in any diagnostic position (ICD-9: 790.2*, ICD-10: R73*). An individual was considered an incident case only once per lifetime, and the incident date was established by the earliest qualifying medical encounter. Prevalent cases (i.e., cases occurring before the start of the surveillance period) were excluded, and active component person-time was censored at the time of the incident case diagnosis. Incidence rates for elevated blood glucose were calculated per 100,000 person-years (p-yrs) of active component service.
A case of T2DM was defined by a record of 2 or more inpatient or outpatient medical encounters occurring within 90 days of each other, with a diagnosis of T2DM in the first (primary) diagnostic position (ICD-9: beginning with ‘250’ and the 5th digit is ‘0’ or ‘2’; ICD-10: E11*). If an inpatient or outpatient encounter with a diagnosis for type 1 diabetes (ICD-9: beginning with ‘250’ and the 5th digit is ‘1’ or ‘3’; ICD-10: E10*) was listed in the primary diagnostic position between the first 2 case-defining encounters, then that case was excluded, as the type could not be determined. Inpatient medical encounters for women with a diabetes mellitus diagnosis were excluded if there was a diagnosis for labor and delivery (ICD-9: 650–669, V27; ICD-10: beginning with ‘O’ or Z37) in any diagnostic position within 6 months following the diabetes mellitus encounter, as these were presumed to be cases of gestational diabetes. Encounters with co-occurring diagnoses for gestational diabetes (ICD-9: 648.0; ICD-10: O24.4, O24.91, O24.92, O24.93) were excluded for the same purpose. The incidence date for diabetes mellitus was defined as the date of the first inpatient or outpatient encounter with a diagnosis of T2DM in the primary diagnostic position. A service member was considered an incident case only once per lifetime. As in the prediabetes analysis, prevalent cases were excluded, and active component person-time was censored at the time of the incident case diagnosis. Incidence rates for T2DM were calculated per 100,000 p-yrs of active component service.
RESULTS
Overweight and Obesity
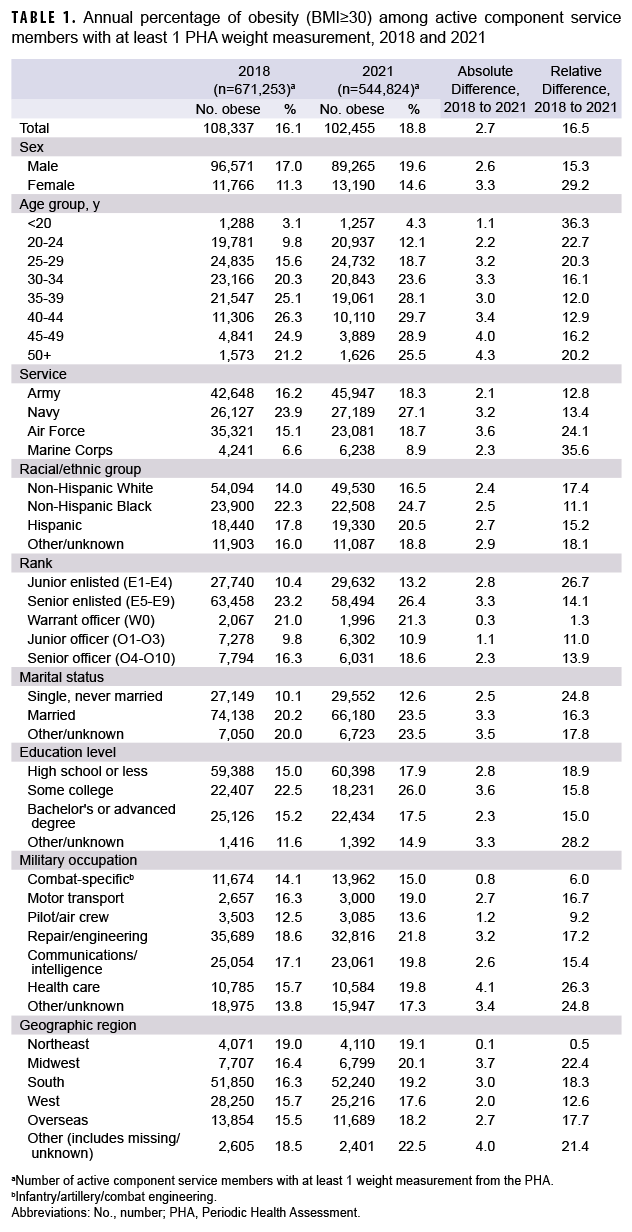
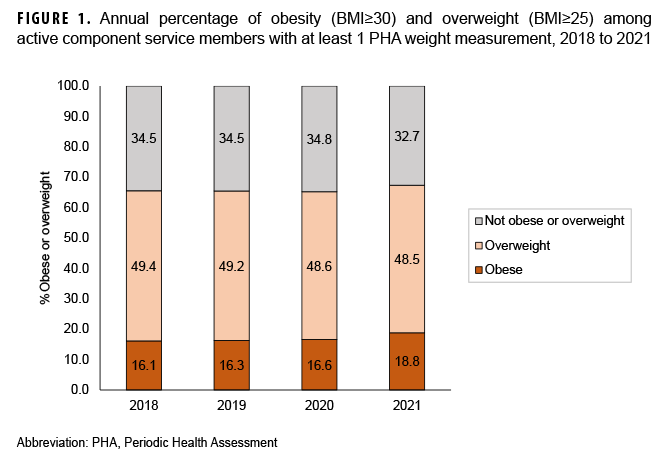
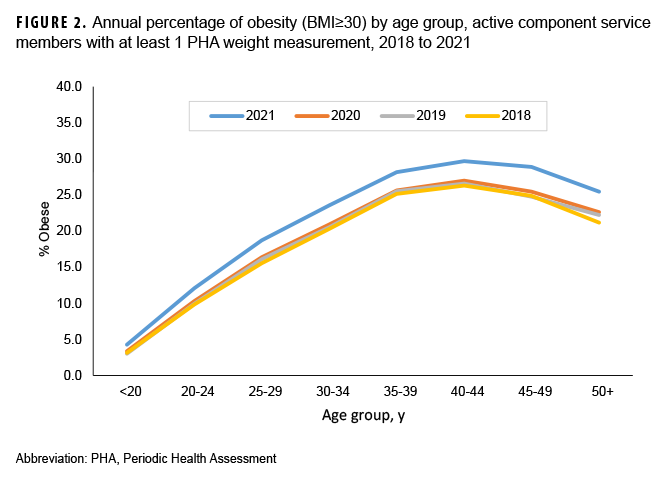
The prevalence of obesity among active component service members who completed a PHA increased from 16.1% in 2018 to 18.8% in 2021 (Table 1, Figure 1). This was a relative increase of 13.3% from 2020, when the obesity prevalence was 16.6% (Figure 1). When both obesity and overweight were considered, the prevalence increased from 65.5% in 2018 to 67.3% in 2021 (Figure 1). The absolute and relative percent increases from 2018 to 2021 were higher in females than males (Table 1). Although the largest relative increases in obesity prevalence were in the youngest (<30 years) age groups, the largest absolute percent increase was in the oldest (50+ years) age category (Table 1). Among military occupations, the largest absolute and relative percent increases in obesity occurred among health care workers. Those in repair and engineering occupations had the highest prevalences of obesity, however, in the calendar years 2018 through 2021 (data not shown). Absolute percent increases were similar by racial/ethnic group and service branch. The Marine Corps demonstrated the largest relative increase, from 6.6% to 8.9%; however, Marines maintained the lowest obesity prevalence compared to the other service branches. The Air Force demonstrated the largest absolute increase, from 15.1% to 18.7%. Non-Hispanic Blacks, Navy service members, males (data not shown), and those aged 40 to 44 years had the highest prevalence of obesity compared to their respective counterparts during each calendar year between 2018 and 2021 (Figure 2).
Prediabetes
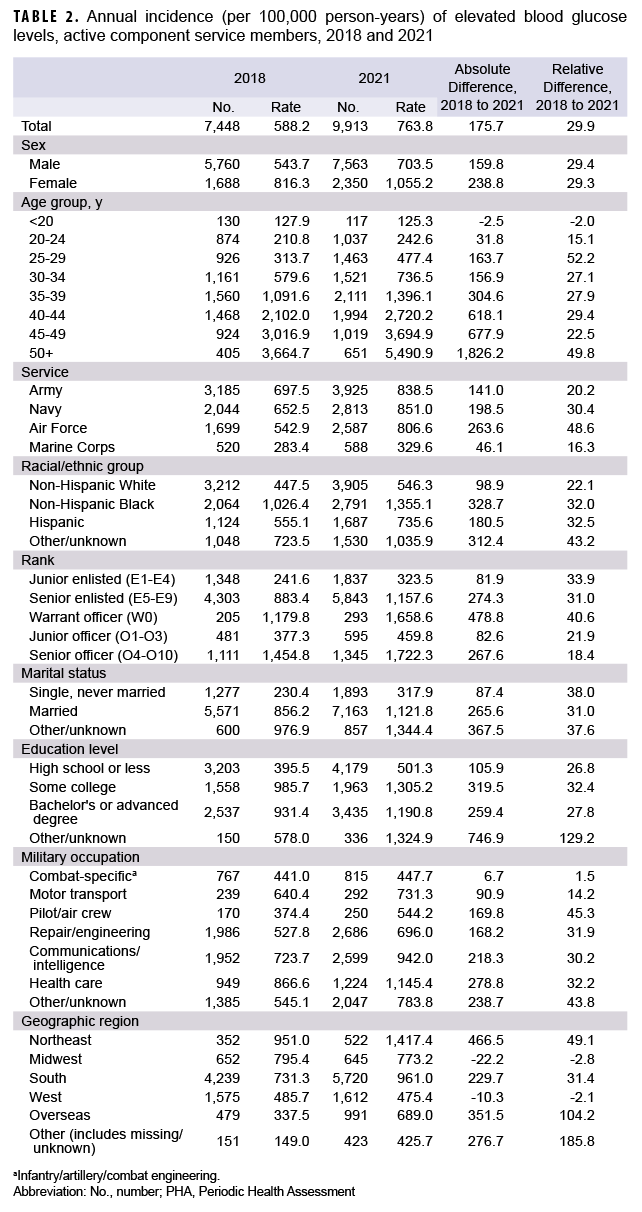
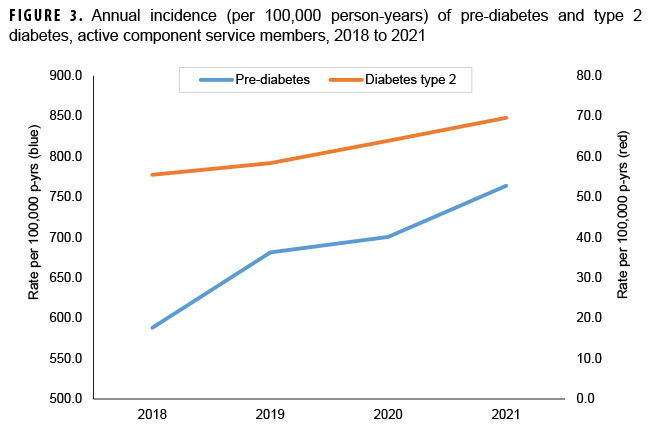
The annual incidence per 100,000 p-yrs of elevated blood glucose rose from 588.2 in 2018 to 763.8 in 2021 (Table 2, Figure 3). The absolute increase in rate of elevated blood glucose from 2018 to 2021 was higher for females than males, but the relative increase was similar for males and females (Table 2). The largest increase in incidence of prediabetes occurred in individuals over the age of 50. Absolute and relative percent increases were highest for Air Force mebers, from 542.9 per 100,000 p-yrs in 2018 to 806.6 per 100,000 p-yrs in 2021. Individuals of non-Hispanic Black race/ethnicity had the largest absolute rate increase, from 1,026.4 to 1,355.1 per 100,000 p-yrs, although the absolute increase was highest among those with other or unknown race/ethnicity. The occupation of military health care worker demonstrated the highest absolute percent increase of elevated blood glucose, although pilots had the largest relative percent increase. Females, non-Hispanic Blacks, health care workers, and those aged 50 years or older each had the highest prevalence of prediabetes compared to their respective counterparts during each calendar year between 2018 and 2021 (data not shown). Navy members had the highest rates between 2019 and 2021, although Army members had the highest rates in 2018 (data not shown).
Type 2 Diabetes Mellitus
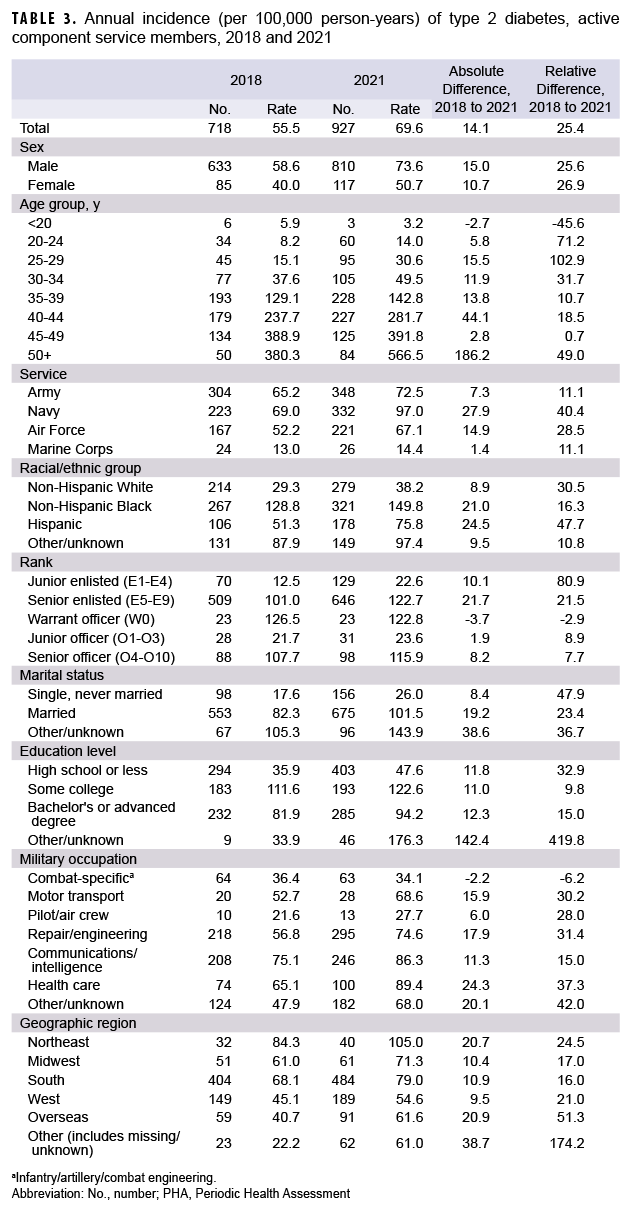
The annual incidence of T2DM among active component service members increased from 55.5 per 100,000 p-yrs in 2018 to 69.6 per 100,000 p-yrs in 2021 (Table 3, Figure 3). The absolute increase in T2DM incidence was higher for males than females, but the relative increase was highest for females (Table 3). Navy members and Hispanics experienced the largest absolute and relative increases in rates between 2018 and 2021. Males, non-Hispanic Blacks, Navy members, those working in health care or communications/intelligence, and those aged 45 years and older had the highest T2DM rates compared to their respective counterparts during each calendar year between 2018 and 2021 (data not shown).
EDITORIAL COMMENT
The increase in BMI noted in this study is not a new trend for the Department of Defense (DOD), as combined overweight and obesity rates increased from 50.6% in 1995 to 60.8% in 2008.18 Furthermore, data from DOD Health of the Force reports demonstrate that, from 2015 to 2019, the overall prevalence of obesity diagnoses within the active component increased from 16% to 18%, and by 2020 the prevalence of obesity reached 19%.19,20 Results from this study demonstrate an escalation of the prevalence of obesity described in the DOD Health of the Force reports. During the years preceding the pandemic, obesity prevalence remained steady around 16%, with smaller relative percent changes occurring between years; for example, the relative percent change in obesity prevalence between 2019 and 2020 was 1.8%. However, after the start of the pandemic, specifically between 2020 and 2021, the relative percent change of obesity prevalence substantially increased, by 13.3%. This coincides with a period when COVID-19 restrictions affected daily activities and lifestyle habits of service members, along with other populations around the globe.
While U.S. states and local authorities implemented CDC COVID-19 guidelines to varying degrees, the DOD’s force health protection guidance, travel restrictions, and health protection conditions drove standardization and compliance across the joint services.21 For deployment readiness, the military services were required to provide “clean,” COVID-19-free forces, and at times this resulted in prolonged restriction of movement and repeated COVID-19 testing prior to mobilization. Increased telework and decreased access to wellness facilities, group physical training, and dining options in the active duty population, along with other COVID-19-related policies, may have also contributed to the sharp 2.2% rise in obesity prevalence captured during the first year of the pandemic (2020-2021).
In this study it is also important to note the relatively higher absolute incidence of prediabetes and T2DM in women, non-Hispanic Blacks, Hispanics, and those aged 45 years and older, which reflect known risk factors also present in the general U.S. population. Lifestyle factors were likely a significant contributor to the high prevalence of obesity and increases in elevated blood glucose and T2DM rates in health care workers compared to other occupations. Service-specific requirements and regulations may also affect rates of elevated BMI and diabetes. For example, the Navy experienced the largest increase in incidence of T2DM; sailors underway on ships and submarines face highly restricted environments with limited food choices, as well as restricted time and space to perform physical training. The services also have different physical fitness standards and methods of measuring fitness at accession and throughout the spectrum of service.
There are some limitations present in this study that should be acknowledged while interpreting the results. Many PHAs are conducted over the phone and are accomplished primarily by record review. Additionally, during in-person PHAs, objective data are frequently recorded based on patient self-reporting, including metrics such as height and weight (the latter of which is frequently underestimated), as opposed to clinical staff obtaining actual measurements. Due to the COVID-19 pandemic, more PHAs were conducted through telehealth than normally completed in person, including PHAs for aviators and individuals in other high performance career fields, which likely contributed to an underestimation of the diagnoses assessed in this study.
Opportunities exist within the current PHA, physical fitness testing, and body composition programs to obtain in-person vital signs, including BMI calculations and laboratory screening for diabetes and other metabolic diseases. Current screening practices across the joint services do not adequately identify individuals with prediabetes. The percentage of active duty service members meeting prediabetes screening criteria between 2014 and 2018 ranged from 47.3% to 56%, yet only 4.8% to 6.7% of those meeting the criteria during that timeframe were actually screened.22 Strategies that identify upstream determinants of health and incorporate effective and sustainable interventions into the MHS care delivery model are needed to address those factors predisposing service members to poor health.
Certain lifestyle factors amplified by the COVID-19 pandemic increased the prevalence of elevated BMI and incidence of both prediabetes and diabetes in service members from 2018 to 2021. These factors can affect national security because of their effects on recruitment and retention. In a recent study of military-aged U.S. populations, only 34.3% of participants met both BMI standards and engaged in adequate physical activity.23 Service members with elevated BMI and poorly controlled diabetes may be required to undergo a medical board and potentially not meet requirements for theater deployment.24
The U.S. Preventive Service Task Force and the CDC recognize that lifestyle change programs, including intensive therapeutic interventions, are evidence-based and critical for preventing and reversing chronic disease.25,26 CDC-approved programs typically require a lifestyle coach specifically trained to lead the program, assist participants in meeting goals, and stay motivated.26 In recent years the Defense Health Agency (DHA) and USAF both started Lifestyle and Performance Medicine working groups that focus on integrating the pillars of lifestyle medicine across the MHS. They seek to offer service members healthier choices at military installations in support of disease prevention and human performance optimization. Numerous studies, including the Blue Zones Project, which investigated the world’s longest living populations, have demonstrated that lifestyle characteristics have significant effects on longevity. Findings from these studies support prioritization of whole food plant-based nutrition, natural movement, committed social networks, adequate rest, stress management, and healthy choices including avoidance of risky substances.27
Author Affiliations
Rocky Vista University College of Osteopathic Medicine (Dr. Regan A. Stiegmann); 354th Operational Medical Readiness Squadron, Eielson AFB, AK (Lt Col Chelsea B. Payne); Air Force Medical Readiness Agency (Col Mary Anne Kiel); Armed Forces Health Surveillance Division (Dr. Shauna L. Stahlman).
Acknowledgements
The authors would like to thank members of the USAF Lifestyle & Performance Medicine Working Group, and all of their military and civilian collaborators in realms of Lifestyle Medicine and Lifestyle & Performance Medicine. They would also like to thank the Armed Forces Health Surveillance Division, specifically Dr. Stephen Taubman as the analyst who collected and aggregated the data.
Disclaimer
The opinions and assertions expressed herein are those of the authors and do not necessarily reflect the official policy or position of the United States Air Force or the United States Department of Defense. The authors have no financial interests in any commercial product, service, or organization to disclose.
References
- Centers for Disease Control and Prevention. Covid data tracker. http://covid.cdc.gov/covid-data-tracker. Accessed December 5, 2022.
- Ahmad FB, Cisewski JA, Anderson RN. Provisional mortality data–United States, 2021. MMWR. 2022;71:597-600. https://www.cdc.gov/mmwr/volumes/71/wr/mm7117e1.htm. Accessed December 5, 2022.
- Centers for Disease Control and Prevention. Underlying medical conditions associated with higher risk for severe COVID-19: information for healthcare professionals. https://www.cdc.gov/coronavirus/2019-ncov/hcp/clinical-care/underlyingconditions.html. Updated February 15, 2022. Accessed December 6, 2022.
- Centers for Disease Control and Prevention. About overweight and obesity. https://www.cdc.gov/obesity/about-obesity/index.html. Accessed April 25, 2022.
- Fryar, CD, Carroll MD, Affull J. Prevalence of overweight, obesity and severe obesity among adults age 20 and over: United States 1960-1962 through 2017-2018. National Center for Health Statistics. https://www.cdc.gov/nchs/data/hestat/obesity-adult-17-18/obesity-adult.htm. Accessed April 25, 2022.
- Lange SJ, Kompaniyets L, Freedman DS, et al. Longitudinal trends in body mass index before and during the COVID-19 pandemic among persons aged 2-19 years–United States 2018-2020. CDC Weekly. 2021;70(37):1278-1283. https://www.cdc.gov/mmwr/volumes/70/wr/mm7037a3.htm. Accessed December 6, 2022.
- Beck AL, Huang JC, Lendzion L, et al. Impact of the coronavirus disease 2019 pandemic on parents' perception of health behaviors in children with overweight and obesity. Acad Pediatr. 2021;21(8):1434-1440. doi:10.1016/j.acap.2021.05.015. Accessed December 6, 2022.
- Stavridou A, Kapsali E, Panagouli E, et al. Obesity in children and adolescents during COVID-19 pandemic. Children. 2021;8(2):135. https://www.mdpi.com/2227-9067/8/2/135. Accessed December 6, 2022.
- National Institute of diabetes and Digestive and Kidney Diseases. Health risks of overweight & obesity. https://www.niddk.nih.gov/health-information/weight-management/adult-overweight-obesity/health-risks. Accessed July 13, 2022.
- Centers for Disease Control and Prevention. Type 2 diabetes. https://www.cdc.gov/diabetes/basics/type2.html. Accessed April 11, 2022.
- Centers for Disease Control and Prevention. Incidence of newly diagnosed diabetes. In: National Diabetes Statistics Report. https://www.cdc.gov/diabetes/data/statistics-report/newly-diagnosed-diabetes.html. Accessed April 25, 2022.
- Schmitt, JA, Ashraf, AP, Becker DJ, Sen B. Changes in type 2 diabetes trends in children and adolescents during the COVID-19 pandemic. J Clin Endocrinol Metab. 2022. 16;107(7):e2777-e2782. https://www.ncbi.nlm.nih.gov/pmc/articles/PMC8992346/. Accessed December 6, 2022.
- Centers for Disease control and Prevention. Prevalence of prediabetes among adults. https://www.cdc.gov/diabetes/data/statistics-report/prevalence-of-prediabetes.html. Accessed April 25, 2022.
- Finkelstein EA, Trogdon JG, Cohen JW, Dietz W. Annual medical spending attributed to obesity: payer- and service-specific estimates. Health Aff (Millwood). 2009;28(5):822-831. https://pubmed.ncbi.nlm.nih.gov/19635784/. Accessed December 6, 2022.
- Cowan DN, Bedno SA, Urban N, Yi B, Niebuhr DW. Musculoskeletal injuries among overweight army trainees: incidence and healthcare utilization. Occup Med. 2011;61(4):247-252. doi:10.1093/occmed/kgr028. Accessed December 6, 2022.
- Sammito S, Hadzic V, Karakolis T et al. Risk factors for musculoskeletal injuries in the military: a qualitative systematic review of the literature from the past two decades and a new prioritizing injury model. Mil Med Res. 2021;10;8(1):66. https://ncbi.nlm.nih.gov/pmc/articles/PMC8662851/. Accessed December 6 2022.
- Centers for Disease Control and Prevention. About adult BMI. https://www.cdc.gov/healthyweight/assessing/bmi/adult_bmi/index.html. Accessed September 4, 2022.
- Reyes-Guzman CM, Bray RM, Forman-Hoffman VL, Williams J. Overweight and obesity trends among active duty military personnel: a 13-year perspective. Am J Prev Med. 2015;48(2):145-153.https://pubmed.ncbi.nlm.nih.gov/25442226. Accessed December 6, 2022.
- Armed Forces Health Surveillance Division. Department of Defense Health of the Force 2019. https://www.health.mil/Military-Health-Topics/Health-Readiness/AFHSD/Reports-and-Publications. Accessed July 15, 2022.
- Armed Forces Health Surveillance Division.Department of Defense Health of the Force 2020.https://www.health.mil/Military-Health-Topics/Health-Readiness/AFHSD/Reports-and-Publications. Accessed July 15, 2022.
- U.S. Department of Defense. Coronavirus: Latest DoD Guidance. https://www.defense.gov/Spotlights/Coronavirus-DOD-Response/Latest-DOD-Guidance/. Accessed September 24, 2022.
- Clutter CA, Beckman DJ, Wardian JL, RittelAG, True MW. Are we missing an opportunity? prediabetes in the U.S. military. Mil Med. 2022;197. doi:10.1093/milmed/usac197. Accessed December 6, 2022.
- Webber BJ, Bornstein DB, Deuster PA, et al.BMI and physical activity, military-aged U.S. population 2015-2020. Am J Prev Med; 2022. https://doi.org/10.1016/j.amepre.2022.08.008. Accessed December 6, 2022.
- AFRICOM Command Instruction 4200.09B. Theater Medical Clearance. 2022. https://www.africom.mil/staff-resources/theater-medical-clearance. Accessed December 6, 2022.
- U.S. Preventive Services Task Force. Weight Loss to Prevent Obesity-Related Morbidity and Mortality in Adults: Behavioral Interventions. https://www.uspreventiveservicestaskforce.org/uspstf/document/RecommendationStatementFinal/obesity-in-adults-interventions. Accessed December 6, 2022.
- Centers for Disease Control and Prevention. National diabetes prevention program: lifestyle change program providers. https://www.cdc.gov/diabetes/prevention/index.html. Updated August 3,2021. Accessed December 6, 2022.
- Buettner D, Skemp S. Blue Zones: Lessons from the world’s longest lived. Am J Lifestyle Med. 2016;10(5):318-321. doi:10.1177/155982761616637066. Accessed December 6, 2022.