Abstract
Risk factors for heat illnesses (HIs) among new soldiers include exercise intensity, environmental conditions at the time of exercise, a high body mass index, and conducting initial entry training during hot and humid weather when recruits are not yet acclimated to physical exertion in heat. This study used data from the Defense Health Agency’s–Weather-Related Injury Repository to calculate rates and to describe the incidence, timing, and geographic distribution of HIs among soldiers during U.S. Army basic combat training (BCT). From 2014 through 2018, HI events occurred in 1,210 trainees during BCT, resulting in an overall rate of 3.6 per 10,000 BCT person-weeks (p-wks) (95% CI: 3.4–3.8). HI rates (cases per 10,000 BCT p-wks) varied among the 4 Army BCT sites: Fort Benning, GA (6.8); Fort Jackson, SC (4.4); Fort Sill, OK (1.8); and Fort Leonard Wood, MO (1.7). Although the highest rates ofHIs occurred at Fort Benning, recruits in all geographic areas were at risk. The highest rates of HI occurred during the peak training months of June through Sept, and over half of all HI cases affected soldiers during the first 3 weeks of BCT. Prevention of HI among BCT soldiers requires relevant training of both recruits and cadre as well as the implementation of effective preventive measures.
What Are the New Findings?
During 2014–2018 BCT classes, the greatest number of HIs occurred in week 2. The highest overall rate of HI was at Fort Benning (6.8 cases per 10,000 p-wks), followed by Fort Jackson (4.5 per 10,000 p-wks), Fort Sill (1.8 per 10,000 p-wks), and Fort Leonard Wood (1.7 per 10,000 p-wks).
What Is the Impact on Readiness and Force Health Protection?
Service members experience the highest rates of HIs during the first phase of BCT. Entry month should be considered as a modifiable factor to reduce HI rates during training. The findings of this analysis may inform Commanders at each training location about the time of year that targeted mitigation strategies could be most effective.
Background
U.S. military training activities in hot and humid environments pose competing demands from a public health perspective because of the military's obligation to perform realistic training to develop operational capability and readiness while also needing to protect service members against heat-related illness. For example, a recent study examining the risk and timing of heat illness (HI) in the U.S. active duty (AD) Army population demonstrated that the peak incidence of HI occurs during the first 2 months of duty.1 This period is when soldiers are engaged in initial entry training (IET). IET encompasses a variety of courses, each with unique exposures that may affect the risk of HI.
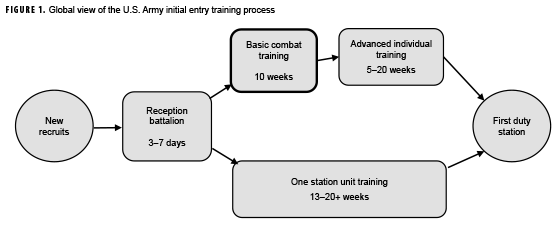
IET consists of 2 phases: basic combat training (BCT) and advanced individual training (AIT). BCT, which lasts 10 weeks, is followed by AIT, which varies from 5 to over 20 weeks, depending on military occupational specialty.2 In one station unit training (OSUT), BCT and AIT take place at the same installation. The 10-week BCT course is conducted at 4 locations: Fort Benning, GA; Fort Jackson, SC; Fort Leonard Wood, MO; and Fort Sill, OK. Figure 1 provides a summary timeline view of the IET process. This study only includes the 10-week period of BCT (i.e., recruits participating in BCT as a part of OSUT were excluded).
No recently published studies have reported HI rates during BCT. The current study assessed the incidence, timing, and geographic distribution of HI during BCT. Information about the timing and geographic location of HI in this population could inform efforts to reduce the burden of HI during the conduct of training essential to the development of individual skills needed for operational capability and readiness of the U.S. Army.
Methods
Study design
The current study employed a retrospective cohort design using data from the Defense Health Agency's (DHA)–Weather-Related Injury Repository (WRIR). The WRIR utilizes many available data sources with the goal of being the most complete record system possible for weather-related injuries in Army soldiers. The WRIR enables researchers to review prior years' data and provides contextual perspective to emerging trends. The WRIR includes 6 main data sources: hospital admissions (from the Standard Inpatient Data Record [SIDR] and from TRICARE Encounter Data–Institutional [TED-I]), in-theater medical records (from the Theater Medical Data Store [TMDS]), reportable medical events (RMEs), and outpatient encounters (from the Comprehensive Ambulatory/Professional Encounter Record [CAPER] and from TRICARE Encounter Data–Non-Institutional [TED-NI]). The WRIR began collecting data in 2014, so it includes International Classification of Diseases (ICD) codes from both the 9th and 10th revisions.
Study population
All U.S. Army enlisted soldiers who began BCT for the first time at any of the 4 BCT sites from Jan. 2014 through Dec. 2018 were included in the analysis. In order to better compare variables of interest in the training population, recruits conducting BCT as part of OSUT were excluded from the analysis. BCT rosters from 2014–2018 were downloaded from the Army Training Requirements and Resources System (ATRRS). Each BCT site has a unique school code, which was used to pull the data from ATRRS.
Outcome
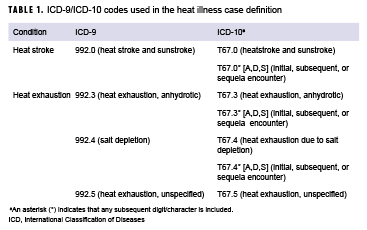
The outcome of interest was the occurrence of any HI. For this analysis, the identification of a case of HI was based on the Armed Forces Health Surveillance Branch (AFHSB) surveillance case definition and included heat exhaustion (HE) and heat stroke (HS).3 The AFHSB case definition defines a case of HI as 1 hospitalization or outpatient medical encounter with selected diagnoses of HI (Table 1) in the primary or secondary diagnostic position or 1 record of an RME of HI reported to the Disease Reporting System internet.4
The incidence date was the date of the first hospitalization, outpatient encounter, or RME associated with an HI. For individuals with more than 1 type of HI medical encounter during BCT, HS is prioritized over HE. Outcome data extracted from the WRIR were matched to ATRRS BCT roster data by social security number. Cases were included in the analysis only if the first encounter date fell between a recruit's first and last day of class in BCT.
Basic combat training exposure time and seasonality
Army BCT is conducted throughout the year and includes the following 3 phases:
Red phase (phase 1; weeks 1–3): The red phase consists of an environment where recruits must demonstrate that they possess the foundation for physical fitness, resiliency, and a level of adaptability to military life. Strenuous outdoor activities with an overlapping risk of heat exposure include 2.5- and 5-mile foot marches.
White phase (phase 2; weeks 4–6): The white phase is centered on the development of basic combat skills, with special emphasis on weapons qualification and physical readiness training. Strenuous outdoor activities with an overlapping risk of heat exposure include a 7.5-mile foot march, land navigation exercises, and time spent at rifle ranges.
Blue phase (phase 3; weeks 7–10): The blue phase includes a 10-mile foot march and concentrates on tactical training, increased soldier responsibilities, and demonstration of teamwork and self-discipline. Recruits are evaluated in basic soldiering skills and prepared for AIT. The blue phase culminates in a field training exercise and the demonstration of proficiency in warrior tasks and battle drills.
Recruit exposure time was measured using a time-to-event approach (measured in weeks). For each recruit, exposure time began at the BCT class starting date and continued until censored because of an outcome event (an HI), attrition from BCT, or the end of the BCT class, whichever occurred first. Censoring due to attrition was identified by the graduation status variable from ATRRS.
Because BCT classes begin throughout the calendar year, each BCT class experiences unique month-to-month variation in weather-related exposures due to interannual seasonal variation. In order to control for the effect of this variation, data were analyzed by BCT phase and grouped by the month in which recruits started BCT. A recruit was considered to have entered BCT in a given month if their class start date fell within the first 20 days of the month. Recruits whose BCT started on or after the 21st day of a given month were considered to have entered training in the following month.
Statistical analysis
Descriptive analyses included chisquare tests for differences in the outcome frequency distributions by BCT entry-month and site. For BCT site and phase-specific rates, the frequency distribution of outcomes was reported by entry-month and site. Site- and phase-specific incidence rates of HI were calculated as the number of HI cases per 10,000 person-weeks (p-wks) with associated 95% confidence interval (CIs). Rate ratios (RRs) were computed by BCT site and entry-month using Fort Leonard Wood as the reference group because of its northernmost location. Because of low case counts at Fort Leonard Wood during the fall and winter months, RRs are reported for spring and summer months only. P values less than .05 were considered statistically significant. Exact RR estimates, 95% CIs, and mid-p values were calculated using OpenEpi v3.01.5
Results
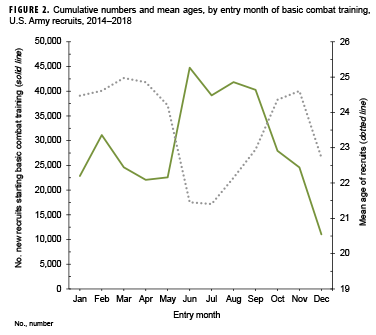
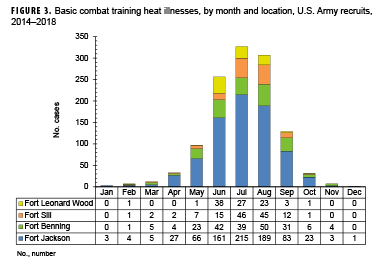
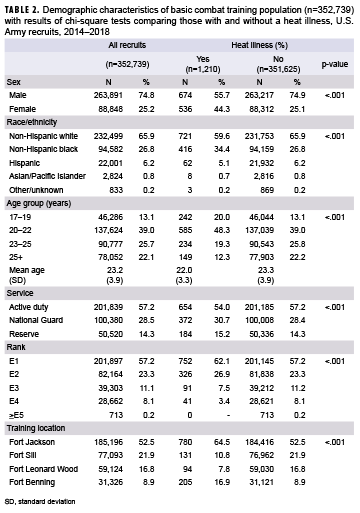
A total of 352,739 recruits entered BCT for the first time during 2014–2018 and were included in the current study (Table 2). Although total annual recruit arrivals varied from year-to-year, the distribution of recruit arrivals by month remained consistent, with an average low of approximately 4,500 recruit arrivals in Jan. to an average high of 9,000 recruit arrivals in June (data not shown). As a result of high school graduation, there is a predictable surge of new and younger recruits entering BCT during the summer months (Figure 2). The BCT population was observed for a total of 3,362,271 p-wks. The mean observed time per recruit was 9.5 weeks (median,9.7; standard deviation, 0.95; range, 0–10 weeks) (data not shown). A total of 9,159 HIs were reported in the WRIR during the study period among all AD Army service members, of which 13.2% (n=1,210) occurred during BCT. The proportion of recruits without any HI who successfully graduated BCT was 90.0% (n=316,205/351,529) compared to 66.9% (n=809/1,210) of those who were diagnosed with an HI (data not shown). During the 5-year surveillance period, July had the highest total number (n=327) and proportion (27.0%) of HI cases (Figure 3).
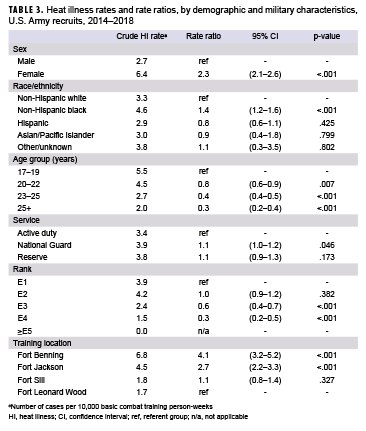
The demographic characteristics of all recruits and those affected by an HI are shown in Table 2. The rates of HI events were significantly higher among several demographic groups (Table 3). The HI rate was higher among women than men (RR: 2.3) and higher among non-Hispanic black recruits than those in all other race/ethnicity groups. Recruits aged 20 years or older were less likely than those aged 17–19 years to be affected by an HI. Soldiers in the National Guard had slightly increased rates (RR: 1.1) compared to soldiers in the AD component.
Basic combat training location
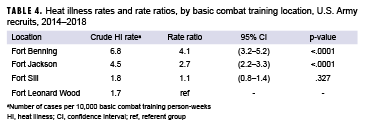
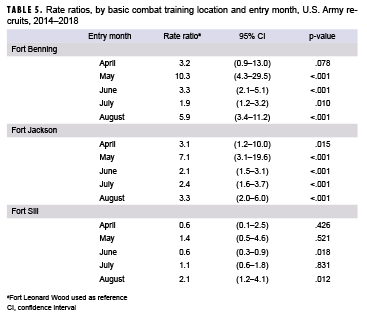
Incident HIs were disproportionately distributed among the individual BCT sites, with the highest rate at Fort Benning (6.8 per 10,000 p-wks), followed by Fort Jackson (4.5 per 10,000 p-wks), Fort Sill (1.8 per 10,000 p-wks), and Fort Leonard Wood (1.7 per 10,000 p-wks) (Table 4). Further, recruits who received BCT at Fort Benning had 4.1 (95% CI: 3.2–5.2) times the rate of HI events compared to recruits who received BCT at Fort Leonard Wood. The rate of HI events among Fort Jackson recruits was 2.7 times the rate among Fort Leonard Wood recruits. After controlling for the entry month of BCT, recruits at both Fort Benning and Fort Jackson experienced HI rates that were between 1.9 and 10.3 times the rates among recruits at Fort Leonard Wood for the months of May–Aug. (Table 5). For example, among recruits who started in August, those at Fort Benning experienced 5.9 (95% CI: 3.4–11.2) times the rate of HI events compared to recruits at Fort Leonard Wood.
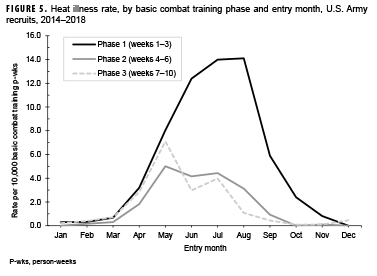
Basic combat training phase
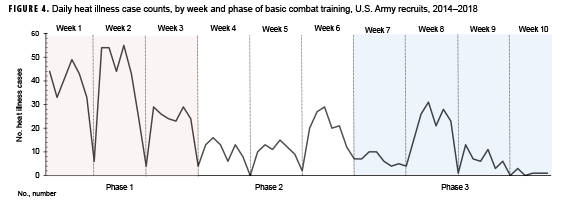
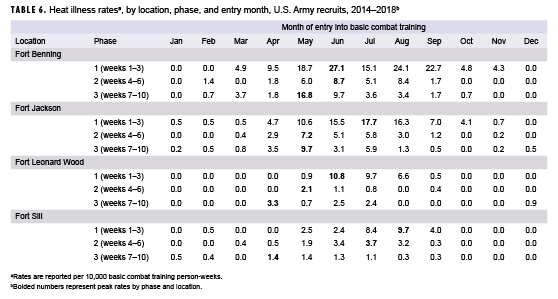
Of the 1,210 total HIs that occurred during BCT, 686 (56.8%) occurred during phase 1 of training, 277 (22.9%) occurred during phase 2, and 247 (20.4%) occurred during phase 3 (data not shown). The greatest number of incident HI cases occurred in the second week of training (Figure 4), when 23.0% of all HI events occurred (data not shown). In unadjusted analyses, phase 1 of BCT had the highest HI rates at all BCT sites, with 6.5 cases per 10,000 p-wks, followed by phases 2 and 3 with 2.0 and 1.8 cases per 10,000 p-wks, respectively (data not shown). Entering BCT after May was associated with a substantial increase in phase 1 rates and a small reduction in phase 3 rates (Figure 5). After controlling for location, phase, and entry-month, rates varied widely (Table 6). The highest phase 1 rate was 27.1 HIs per 10,000 p-wks for recruits who entered BCT in June at Fort Benning. At Fort Leonard Wood, the highest phase 1 rates were also seen among recruits who entered BCT in June (10.8 per 10,000 p-wks). On the other hand, phase 1 rates at Fort Sill peaked at 9.7 per 10,000 p-wks for those who entered in Aug., and phase 1 rates at Fort Jackson peaked at 17.7 per 10,000 p-wks for those who entered in July (Table 6).
Editorial Comment
This study examined the timing of HI events among recruits during BCT by month of entry into training and phase of training at each of the 4 BCT locations. HI events occurred at all BCT locations and during all phases of BCT. However, variability in the rates, measured in numbers of HI events per 10,000 p-wks, was seen across BCT sites, BCT entry-month, and BCT training phase. When location was examined, the southernmost locations (Fort Benning and Fort Jackson) had the highest rates of HI events, and rates were significantly higher when compared to the northernmost BCT site (Fort Leonard Wood). This is consistent with the results of a study of active component service members between 2013 and 2017, where Fort Benning and Fort Jackson were among the top 5 Army locations with the highest numbers of HI events.6
Despite being located in the southeastern U.S., Fort Benning and Fort Jackson had significantly different HI rates. The quantifiable factors examined in this study did not fully explain this difference. The recruits at these 2 BCT sites experience similar weather environments and training schedules; however, there are many individual risk factors for HI that could not be controlled for in this study. For example, other studies have found that physical fitness, body composition, sex, individual motivation, medication, and prior illness are associated with an increased risk of HI.1,6–8 While differences in the overall HI injury risk by BCT location have been reported in the past, future investigations into the causes of these differences may benefit from inclusion of environmental and/or local climatological data, factors related to the delivery of training, and care-seeking behavior.9,10 Another factor that is difficult to control for between BCT sites is diagnostic consistency among medical providers and access to medical care. For example, Fort Benning has an emergency department on the installation; Fort Jackson does not. This may result in considerable and systemic variations in HI diagnosis.
If a recruit entered BCT between May and Nov., rates of HIs were highest during phase 1. In the later BCT training phases, HI rates were highest among recruits who entered training in May. Each phase is approximately 3 weeks long, so for a recruit entering BCT in May, the later phases of BCT would coincide with the peak summer months of July and Aug. It is possible that these recruits have adapted to the physical intensity of BCT, but have not been fully acclimatized to hot and humid conditions.
At the time of this report, this was the only study that examined the rate of HI during Army BCT controlling for BCT entry-month and training phase. However, the studies that have been conducted tend to support the results of the current analysis. For example, a study of Army enlisted soldiers found that the highest rates of mild and severe HI occurred within the first 2 months of service; however, this study did not specifically examine the time the enlistees spent in BCT.1 Moreover, a study of Marine Corps recruits found that the highest number of HI cases occurred during the first 2 weeks of a 12-week recruit training, with a second peak of HI events towards the end of training in weeks 8 and 9,8"supporting the current report" finding of higher rates of HI during the first few weeks of BCT (phase 1). However, unlike the current study, the Marine study did not consider how seasonal variations in temperature affected the number of HI events.
HI events occurred during each month of the year, but as expected, the majority of HI events at BCT occurred during the summer months (June–Aug.). This is a common finding across the HI literature describing military populations.1,11,12 Approximately 70,000 recruits entered BCT per calendar year from 2014–2018. The surge of new and younger recruits entering BCT during the hottest months leads to a larger number of recruits completing phase 1 of their training during the period when they are most at risk for an HI.
The findings of this analysis should be interpreted in light of several important limitations. The first potential limitation is the use of U.S. Army administrative data that is not collected or maintained for research purposes to identify the first-time BCT recruits. Despite potential data quality issues with pertinent variables of interest (e.g., training dates) previous research suggests that data sources like the ones used to identify this cohort of likely first-time BCT recruits are valid and consistent with other estimates of the BCT population.13 The second potential limitation is that while the ICD-9/ICD-10 coding was largely used to define outcomes, a single ICD code may not represent a true or final diagnosis. Moreover, diagnosis coding can be subject to clinician- or site-specific bias and ultimately lead to a potential source of misclassification bias. In order to reduce this bias, the current analysis included only medical records with a code of interest in the first 2 diagnostic code positions. Third, recruits in OSUT, AIT, or basic officer leadership courses were excluded from this analysis. Although roughly 70% of all new trainees receive BCT as part of their overall IET, the results of this analysis do not represent the complete burden of HI for all service members as evidenced by the fact that the 1,210 HI cases in this study accounted for only 13% (n=1,210/9,159) of all HI cases in Army service members (active component, National Guard, Reserve) during the study period. Fourth, this study did not incorporate climate data (e.g., temperature, humidity, or wind speed) into the analysis. The goal of this study was to identify the differences in HI rates by the timing of BCT entry and BCT phase. The use of climate data in a future analysis could account for short-term (e.g., daily) and long-term (e.g., interannual) variability in local climate and build upon the findings in the current study. Despite these limitations, use of the comprehensive DHA–WRIR data combined with U.S. Army administrative data allowed for a novel level of granularity and insight into the timing and incidence of HI during BCT.
The results of the current study indicate that Fort Benning had the highest rates of HI events, particularly among recruits entering phase 1 training in the summer months (June–Aug.). The rates of HI were lower in the later phases of BCT; however, HI rates increased during BCT phases 2 and 3 among recruits who entered BCT in the spring months (April and May). The identification of periods during the calendar year and within the 10-week training period when rates of HI events are higher could facilitate the targeted implementation of interventions or prevention strategies to mitigate the risk of HI during BCT. Examination of such results by BCT location could inform each site about the time of year when targeted mitigation strategies could be most effective.
Author affiliations: Armed Forces Health Surveillance Branch, Silver Spring, MD (Mr. Barnes, Dr. Ambrose, Ms. Kebisek, Ms. McCabe, Dr. Forrest, and Mr. Steelman); United States Army Public Health Center Clinical Public Health and Epidemiology Directorate, Disease Epidemiology Division (Dr. Maule, Ms. Scatliffe, and LTC Superior).
Disclaimer: The contents, views, or opinions expressed in this publication are those of the author(s) and do not necessarily reflect the official policy or position of the Defense Health Agency, the Department of Defense (DOD), or the Department of the Army.
References
- Nelson DA, Deuster PA, O’Connor FG, Kurina LM. Timing and predictors of mild and severe heat illness among new military enlistees. Med Sci Sport Exer. 2018;50(8):1603–1612.
- Headquarters, Department of the Army, Training and Doctrine Command. TRADOC Regulation 350-6. Enlisted Initial Entry Training Policies and Administration. Washington, DC: Department of the Army; 2018. https://adminpubs.tradoc.army.mil/regulations/TR350-6withChange1.pdf. Accessed 08 March 2019.
- Armed Forces Health Surveillance Branch. Surveillance Case Definition. Heat Illness. March 2018. https://www.health.mil/Reference-Center/Publications/2017/03/01/Heat-Injuries. Accessed 8 March 2019.
- Armed Forces Health Surveillance Branch. Armed Forces Reportable Medical Events: Guidelines and Case Definitions. https://health.mil/Reference-Center/Publications/2017/07/17/Armed-Forces-Reportable-Medical-Events-Guidelines. Accessed 08 March 2019.
- Sullivan KM, Dean A, Soe MM. OpenEpi: a web-based epidemiologic and statistical calculator for public health. Public Health Rep. 2009;124(3):471–474.
- Armed Forces Health Surveillance Branch. Update: Heat illness, active component, U.S. Armed Forces, 2017. MSMR. 2018;25(4):6–10.
- Gardner JW, Kark JA, Karnei K, et al. Risk factors predicting exertional heat illness in male Marine Corps recruits. Med Sci Sport Exer. 1996;28(8):939–944.
- Wallace RF, Kriebel D, Punnett L, et al. Risk factors for recruit exertional heat illness by gender and training period. Aviat Space Environ Med. 2006;77(4):415–421.
- Swedler DI, Knapik JJ, Williams KW, Grier TL, Jones BH. Risk factors for medical discharge from United States Army Basic Combat Training. Mil Med. 2011;176(10):1104–1110.
- Grier TL, Knapik JJ, Canada S, Canham-Chervak M, Jones BH. Risk factors associated with self-reported training-related injury before arrival at the U.S. Army Ordnance School. Public Health. 2011;124(7):417–423.
- Kark, JA, Burr PQ, Wenger CB, Gastaldo E, Gardner JW. Exertional heat illness in Marine Corps recruit training. Aviat Space Environ Med. 1996;67(4):354–360.
- Stacey MJ, Brett S, Woods D, Jackson S, Ross D. Case ascertainment of illness in the British Army: evidence of under-reporting from analysis of Medical and Command notifications, 2009–2013. J R Army Med Corps. 2016;162(2):428–433.
- Sulsky SL, Karlsson LH, Bulzacchelli MT, et al. Methodological challenges of using U.S. Army administrative data to identify a cohort of basic combat trainees and descriptive analysis of trends in characteristics that are potential risk factors for training-related injury. Mil Med. 2014;179(12):1487–1496.