
Military Health System

Brief Report: Male Infertility, Active Component, U.S. Armed Forces, 2013–2017

Image of Sperm is the male reproductive cell  Photo: iStock. Sperm is the male reproductive cell Photo: iStock

Recommended Content:

Medical Surveillance Monthly Report

Background

Infertility, defined as the inability to achieve a successful pregnancy after 1 year or more of unprotected sexual intercourse or therapeutic donor insemination, affects approximately 15% of all couples.1–3 Male infertility is diagnosed when, after testing both partners, reproductive problems have been found in the male.1 A male factor contributes in part or whole to about 50% of cases of infertility.4–6 However, determining the true prevalence of male infertility remains elusive, as most estimates are derived from couples seeking assistive reproductive technology in tertiary care or referral centers, population-based surveys, or high-risk occupational cohorts, all of which are likely to underestimate the prevalence of the condition in the general U.S. population.2,7–12

Infertility in men is typically evaluated using semen analysis to assess sperm concentration, motility, and morphology. The most common causes of male infertility are low sperm production, abnormal sperm function, or problems that affect sperm transport.10 However, the cause of male infertility is unknown (idiopathic male infertility) in up to 40% of cases,7,10 and while many infertile men have oligospermia (low sperm concentrations compared with reference ranges) or azoospermia (the absence of motile sperm in semen), some infertile men have normal sperm concentrations.7 Illness, infection, injury, chronic medical conditions, hormonal disorders, genetic disorders, and lifestyle choices (e.g., heavy alcohol use, smoking, or illicit drug use) also may contribute to male infertility.13 In addition, frequent exposure to certain environmental elements such as high temperatures, toxins, medications, and radiation can adversely affect sperm production and/or sperm function.13

The current report updates and expands on the findings of the previous MSMR analysis of infertility among active component service men.14 Specifically, the current report summarizes the frequencies, rates, temporal trends, types of infertility, and demographic and military characteristics of infertility among active component service men during 2013–2017.

Methods

The surveillance period was 1 Jan. 2013 through 31 Dec. 2017. The surveillance population consisted of active component service members of the U.S. Army, Navy, Air Force, or Marine Corps who served at any time during the surveillance period. Diagnoses were ascertained from administrative records of all medical encounters of individuals who received care in fixed (i.e., not deployed or at sea) medical facilities of the Military Health System (MHS) or civilian facilities in the Purchased CareThe TRICARE Health Program is often referred to as purchased care. It is the services we “purchase” through the managed care support contracts.purchased care system. These data are maintained in the electronic database of the Defense Medical Surveillance System (DMSS). 

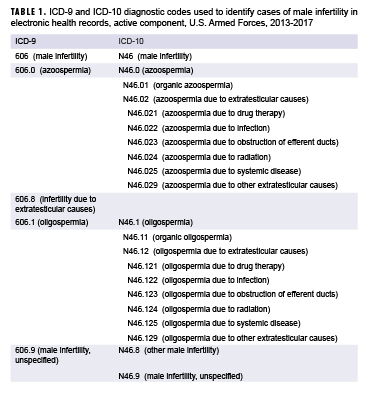
For surveillance purposes, an incident case of male infertility was defined by a case-defining diagnosis (Table 1) in the first diagnostic position of a record of an inpatient or outpatient medical encounter.15 These cases were then grouped into 5 types of male infertility based on the ICD coding system: male infertility unspecified, azoospermia, oligospermia, other male infertility, and infertility due to extratesticular causes. Infertility due to extratesticular causes (ICD-9) was considered a type of male infertility during 2013–2015 only. Other male infertility was considered a type during 2015–2017 only.

The incidence date was considered the date of the first hospitalization or outpatient medical encounter that included a case-defining diagnosis of male infertility. An individual could be counted as an incident case of male infertility only once during the surveillance period; service men with a documented diagnosis of infertility prior to the surveillance period were excluded from the analysis. Incidence rates were calculated as incident male infertility diagnoses per 10,000 person-years (p-yrs) and were stratified by infertility type as well as by demographic and military characteristics. To assess the health care burden associated with male infertility, medical encounters were analyzed separately. The number of inpatient or outpatient encounters with a case-defining diagnostic code recorded in the primary position and the total number of unique individuals affected were computed for each calendar year in the surveillance period.

Results

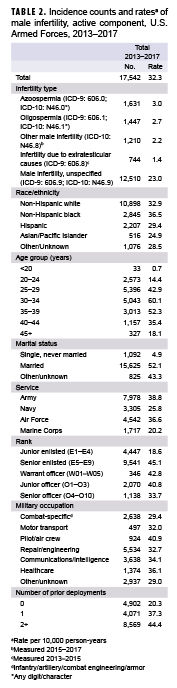
During the 5-year surveillance period, a total of 17,542 active component service men received incident diagnoses of male infertility, for a crude overall incidence rate of 32.3 cases per 10,000 p-yrs (Table 2). The majority of incident male infertility cases were unspecified male infertility (71.3%), followed by azoospermia (9.3%), oligospermia (8.2%), other male infertility (6.9%), and infertility due to extratesticular causes (4.2%). Azoospermia (3.0 per 10,000 p-yrs) and oligospermia (2.7 per 10,000 p-yrs) were diagnosed at much lower rates than male infertility, unspecified (23.0 per 10,000 p-yrs).

Compared to their respective counterparts, crude overall rates of incident infertility diagnoses were highest among service men aged 30–34 years (60.1 per 10,000 p-yrs), non-Hispanic blacks (36.5 per 10,000 p-yrs), those who were married (52.1 per 10,000 p-yrs), senior enlisted service men (45.1 per 10,000 p-yrs), those working as pilots/air crew (40.9 per 10,000 p-yrs), and those who had 2 or more prior deployments (44.4 per 10,000 p-yrs). Across the services, overall rates of male infertility diagnoses were highest among Army (38.8 per 10,000 p-yrs) or Air Force members (36.6 per 10,000 p-yrs) and lowest among Marine Corps members (20.2 per 10,000 p-yrs) (Table 2).

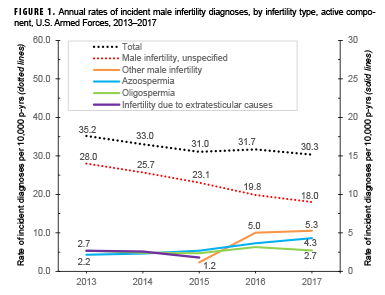
Annual rates of incident diagnoses of total male infertility decreased slightly from 35.2 per 10,000 p-yrs in 2013 to 30.3 per 10,000 p-yrs in 2017 (Figure 1). Rates of diagnoses of male infertility, unspecified showed a steady decrease (35.7%) over the course of the 5-year period from 28.0 per 10,000 p-yrs in 2013 to 18.0 per 10,000 p-yrs in 2017. Annual rates of incident azoospermia diagnoses increased from 2.2 per 10,000 p-yrs in 2013 to 4.3 per 10,000 p-yrs in 2017, while annual rates of incident oligospermia diagnoses were relatively stable during the period. Annual incidence rates of other male infertility diagnoses (ICD-10 only) increased markedly, rising from 1.2 per 10,000 p-yrs in 2015 (first year of use of this diagnostic code) to 5.3 per 10,000 p-yrs in 2017. Annual rates of infertility due to extratesticular causes (ICD-9 only) remained relatively low and stable during 2013–2015 (Figure 1).

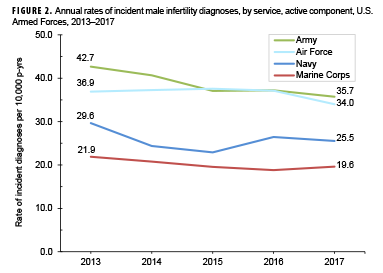
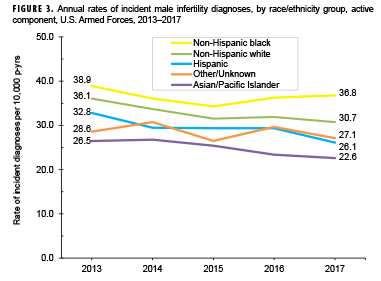
Stratification of annual incidence rates of male infertility diagnoses by age group showed that rates among service men aged 30–34 years were consistently higher than rates among those in other age groups (data not shown). During the 5-year surveillance period, annual rates of incident diagnoses of male infertility decreased in each service (Figure 2). During each year of the period, incidence rates of male infertility diagnoses were highest among Army and Air Force members. Annual rates of male infertility diagnoses were intermediate among Navy members and lowest among Marine Corps members. However, compared to their respective counterparts, service men in the Army showed the greatest decrease (16.3%) in male infertility rates over time. Decreases over time in annual rates of incident male infertility diagnoses were seen in all race/ethnicity groups; Hispanic service men showed the greatest decrease over time and those of other/unknown race/ethnicity and non-Hispanic black service men showed the smallest decreases (Figure 3).

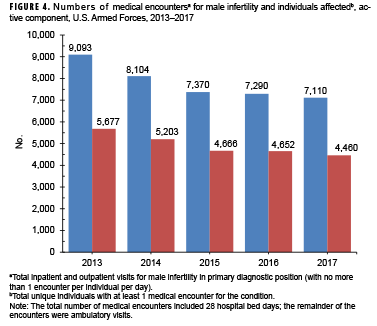
From 2013 through 2017, annual numbers of medical encounters during which male infertility was recorded as a primary (first-listed) diagnosis decreased 21.8% between 2013 and 2017 (Figure 4). Because there was a comparable decrease (21.4%) in the number of individuals affected, the ratio of medical encounters per individual affected remained steady at 1.6 throughout the surveillance period.

Editorial Comments

Annual rates of incident diagnoses of total male infertility among active component service men decreased slightly during 2013–2017. The overall trend in annual rates closely reflected and was primarily influenced by the trend in incident diagnoses of unspecified male infertility. Data on trends in the incidence of male infertility in the general U.S. population during a comparable time period were not available at the time of this report, precluding com­parisons to the current results.

Similar to the findings of the 2014 MSMR analysis of incident diagnoses of male infertility among active component service men during 2000–2012, annual rates were consistently higher among service men aged 30–34 years compared to those in other age groups.14 The overall rate of incident diagnoses of male infertility was also highest among non-Hispanic black service men, which is consistent with the findings of the prior MSMR analysis.14 U.S. data on male factor infertility by race/ethnicity are limited in the current literature. In age-adjusted analyses of data from U.S. veterans, Hispanic men had the highest frequency of treatment for male infertility, followed by non-Hispanic black men and non-Hispanic white men.16 However, a 2001 retrospective study using a centralized database of patient records at a single military male infertility clinic found that race did not appear to be a significant factor influencing the prevalence of male infertility (i.e., the racial background of the study population mirrored that of all MHS beneficiaries).17 More recently, in samples of U.S. men seeking infertility evaluation and/or treatment, non-Hispanic blacks were found to have lower mean semen volume, sperm concentration, total sperm count, and total motile sperm than non-Hispanic whites or Hispanics.18–21

In the current analysis, azoospermia accounted for 9.3% of the incident diagnoses of infertility. This finding is similar to prior literature, which found that 10–15% of all infertile men produce semen devoid of viable sperm.22–24

The results presented here must be interpreted in light of several important limitations. First, to the extent that some affected service men did not seek care for infertility or sought care outside of the MHS, the counts and rates reported here underestimate the actual counts and rates of male infertility in the active component of the U.S. Armed Forces. Another limitation of the current analysis is related to the implementation of MHS GENESIS, the new electronic health record for the MHS. For 2017, medical data from sites that were using MHS GENESIS are not available in DMSS. These sites include Naval Hospital Oak Harbor, Naval Hospital Bremerton, Air Force Medical Services Fairchild, and Madigan Army Medical Center. Therefore, medical encounter data for individuals seeking care at any of these facilities during 2017 were not included in the analysis. Finally, because incident cases were identified based on the presence of a qualifying ICD-9 or ICD-10 diagnosis code for male infertility recorded during a health care encounter, the validity of the results depends upon the accuracy of a physician-assigned diagnosis of male infertility and the resultant diagnostic coding generated by a given encounter. However, a recent claims-based study of 11,068 male patients at a single U.S. institution to assess whether ICD-9 codes accurately identified men with abnormal semen analyses25 found that the specificity of diagnostic coding for azoospermia, oligospermia, infertility due to extratesticular causes, and unspecified male infertility were all greater than 90%. However, sensitivity was not calculated, as not all patients had a documented semen analysis.26

References

  1. Practice Committee of the American Society for Reproductive Medicine. Definitions of infertility and recurrent pregnancy loss: a committee opinion. Fertil Steril. 2013;99(1):63.
  2. Thonneau P, Marchand S, Tallec A, et al. Incidence and main causes of infertility in a resident population (1,850,000) of three French regions (1988-1989). Hum Reprod. 1991;6(6):811–816.
  3. Thoma ME, McLain AC, Louis JF, et al. Prevalence of infertility in the United States as estimated by the current duration approach and a traditional constructed approach. Fertil Steril. 2013;99(5):1324–1331.
  4. Dupree JM. Insurance coverage for male infertility care in the United States. Asian J Androl. 2016;18(3):339–341. 
  5. Hull MG, Glazener CM, Kelly NJ, et al. Population study of causes, treatment, and outcome of infertility. Br Med J (Clin Res Ed). 1985;291(6510):1693–1697. 
  6. Mehta A, Nangia AK, Dupree JM, Smith JF. Limitations and barriers in access to care for male factor infertility. Fertil Steril. 2016;105(5):1128–1137.
  7. Jungwirth A, Giwercman A, Tournaye H, et al. European Association of Urology guidelines on male infertility: the 2012 update. Eur Urol. 2012;62(2):324–332.
  8. Agarwal A, Mulgund A, Hamada A, Chyatte MR. A unique view on male infertility around the globe. Reprod Biol Endocrinol. 2015;13:37.
  9. Martinez G, Daniels K, Chandra A. Fertility of men and women aged 15–44 years in the United States: National Survey of Family Growth, 2006–2010. Natl Health Stat Report. 2012;(51):1–28.
  10. 1Winters BR, Walsh TJ. The epidemiology of male infertility. Urol Clin North Am. 2014;41(1):195–204.
  11. Alavanja MC, Sandler DP, McMaster SB, et al. The Agricultural Health Study. Environ Health Perspect. 1996;104(4):362–369.
  12. Sallmen M, Sandler DP, Hoppin JA, Blair A, Baird DD. Reduced fertility among overweight and obese men. Epidemiology. 2006;17(5):520–523.
  13. Centers for Disease Control and Prevention. Reproductive Health. Infertility FAQs. https://www.cdc.gov/reproductivehealth/infertility/. Accessed 28 Feb. 2019. Armed Forces Health Surveillance Center. Surveillance snapshot: male infertility, active component, U.S. Armed Forces, 2000–2012. MSMR. 2014;21(2):13.
  14. Armed Forces Health Surveillance Branch. Surveillance Case Definitions. Male Infertility. https://health.mil/Military-Health-Topics/Combat-Support/Armed-Forces-Health-Surveillance-Branch/Epidemiology-and-Analysis/Surveillance-Case-Definitions. Accessed 28 Feb. 2019.
  15. Meacham RB, Joyce GF, Wise M, Kparker A, Niederberger C. Urologic Diseases in America Project. Male infertility. J Urol. 2007;177(6):2058–2066.
  16. Costabile RA, Spevak M. Characterization of patients presenting with male factor infertility in an equal access, no cost medical system. Urology. 2001;58(6):1021–1024.
  17. Redmon JB, Thomas W, Ma W, et al. Semen parameters in fertile US men: the Study for Future Families. Andrology. 2013;1(6):806–814.
  18. Povey AC, Clyma JA, McNamee R, et al. Modifiable and non-modifiable risk factors for poor semen quality: a case-referent study. Hum Reprod. 2012;27(9):2799–2806.
  19. Walsh TF, Feigenbaum SL, Smith JF, Croughan MS, VanDenEeden SK. Epidemiologic characteristics of men evaluated for infertility in a large, pre-paid insurance plan. Fertil Steril. 2008;90(suppl):S63.
  20. Khandwala YS, Zhang CA, Li S, Behr B, Guo D, Eisenberg ML. Racial variation in semen quality at fertility evaluation. Urology. 2017;106:96–102.
  21. Eisenberg ML, Lathi RB, Baker VL, Westphal LM, Milki AA, Nangia AK. Frequency of the male infertility evaluation: data from the National Survey of Family Growth. J Urol. 2013;189(3):1030–1034.
  22. Practice Committee of American Society for Reproductive Medicine in collaboration with Society for Male Reproduction and Urology. Evaluation of the azoospermic male. Fertil Steril. 2008;90:S74–S77.
  23. Gudeloglu A, Parekattil SJ. Update in the evaluation of the azoospermic male. Clinics (Sao Paulo). 2013;68(suppl 1):27–34.
  24. World Health Organization. WHO Laboratory Manual for the examination of human semen and sperm-cervical mucus interaction. 4th ed. Geneva, Switzerland: World Health Organization; 1999.
  25. Khandwala YS, Zhang CA, Li S, Cullen MR, Eisenberg ML. Validity of claims data for the identification of male infertility. Curr Urol Rep. 2017;18(9):68.

Annual rates of incident male infertility diagnoses, by infertility type, active component, U.S. Armed Forces, 2013–2017

Annual rates of incident male infertility diagnoses, by service, active component, U.S. Armed Forces, 2013–2017

Annual rates of incident male infertility diagnoses, by race/ethnicity group, active component, U.S. Armed Forces, 2013–2017

Numbers of medical encounters for male infertility and individuals affected, active component, U.S. Armed Forces, 2013–2017

ICD-9 and ICD-10 diagnostic codes used to identify cases of male infertility in electronic health records, active component, U.S. Armed Forces, 2013-2017

Incidence counts and rates of male infertility, active component, U.S. Armed Forces, 2013–2017

You also may be interested in...

Testosterone Replacement Therapy Use Among Active Component Service Men, 2017

Article
3/1/2019
Testosterone

This analysis summarizes the prevalence of testosterone replacement therapy (TRT) during 2017 among active component service men by demographic and military characteristics. This analysis also determines the percentage of those receiving TRT in 2017 who had an indication for receiving TRT using the 2018 American Urological Association (AUA) clinical practice guidelines. In 2017, 5,093 of 1,076,633 active component service men filled a prescription for TRT, for a period prevalence of 4.7 per 1,000 male service members. After adjustment for covariates, the prevalence of TRT use remained highest among Army members, senior enlisted members, warrant officers, non-Hispanic whites, American Indians/Alaska Natives, those in combat arms occupations, healthcare workers, those who were married, and those with other/unknown marital status. Among active component male service members who received TRT in 2017, only 44.5% met the 2018 AUA clinical practice guidelines for receiving TRT.

Recommended Content:

Medical Surveillance Monthly Report

Vasectomy and Vasectomy Reversals, Active Component, U.S. Armed Forces, 2000–2017

Article
3/1/2019
Sperm is the male reproductive cell  Photo: iStock

During 2000–2017, a total of 170,878 active component service members underwent a first-occurring vasectomy, for a crude overall incidence rate of 8.6 cases per 1,000 person-years (p-yrs). Among the men who underwent incident vasectomy, 2.2% had another vasectomy performed during the surveillance period. Compared to their respective counterparts, the overall rates of vasectomy were highest among service men aged 30–39 years, non-Hispanic whites, married men, and those in pilot/air crew occupations. Male Air Force members had the highest overall incidence of vasectomy and men in the Marine Corps, the lowest. Crude annual vasectomy rates among service men increased slightly between 2000 and 2017. The largest increases in rates over the 18-year period occurred among service men aged 35–49 years and among men working as pilots/air crew. Among those who underwent vasectomy, 1.8% also had at least 1 vasectomy reversal during the surveillance period. The likelihood of vasectomy reversal decreased with advancing age. Non-Hispanic black and Hispanic service men were more likely than those of other race/ethnicity groups to undergo vasectomy reversals.

Recommended Content:

Medical Surveillance Monthly Report

Re-evaluation of the MSMR Case Definition for Incident Cases of Malaria

Article
2/1/2019
Anopheles merus

The MSMR has been publishing the results of surveillance studies of malaria since 1995. The standard MSMR case definition uses Medical Event Reports and records of hospitalizations in counting cases of malaria. This report summarizes the performance of the standard MSMR case definition in estimating incident cases of malaria from 2015 through 2017. Also explored was the potential surveillance value of including outpatient encounters with diagnoses of malaria or positive laboratory tests for malaria in the case definition. The study corroborated the relative accuracy of the MSMR case definition in estimating malaria incidence and provided the basis for updating the case definition in 2019 to include positive laboratory tests for malaria antigen within 30 days of an outpatient diagnosis.

Recommended Content:

Medical Surveillance Monthly Report

Update: Incidence of Glaucoma Diagnoses, Active Component, U.S. Armed Forces, 2013–2017

Article
2/1/2019
Glaucoma

Glaucoma is an eye disease that involves progressive optic nerve damage and vision loss, leading to blindness if undetected or untreated. This report describes an analysis using the Defense Medical Surveillance System to identify all active component service members with an incident diagnosis of glaucoma during the period between 2013 and 2017. The analysis identified 37,718 incident cases of glaucoma and an overall incidence rate of 5.9 cases per 1,000 person-years (p-yrs). The majority of cases (97.6%) were diagnosed at an early stage as borderline glaucoma; of these borderline cases, 2.2% progressed to open-angle glaucoma during the study period. No incident cases of absolute glaucoma, or total blindness, were identified. Rates of glaucoma were higher among non-Hispanic black (11.0 per 1,000 p-yrs), Asian/Pacific Islander (9.5), and Hispanic (6.9) service members, compared with non-Hispanic white (4.0) service members. Rates among female service members (6.6 per 1,000 p-yrs) were higher than those among male service members (5.8). Between 2013 and 2017, incidence rates of glaucoma diagnoses increased by 75.4% among all service members.

Recommended Content:

Medical Surveillance Monthly Report

Update: Malaria, U.S. Armed Forces, 2018

Article
2/1/2019
Anopheles merus

Malaria infection remains an important health threat to U.S. service mem­bers who are located in endemic areas because of long-term duty assign­ments, participation in shorter-term contingency operations, or personal travel. In 2018, a total of 58 service members were diagnosed with or reported to have malaria. This represents a 65.7% increase from the 35 cases identi­fied in 2017. The relatively low numbers of cases during 2012–2018 mainly reflect decreases in cases acquired in Afghanistan, a reduction due largely to the progressive withdrawal of U.S. forces from that country. The percentage of cases of malaria caused by unspecified agents (63.8%; n=37) in 2018 was the highest during any given year of the surveillance period. The percent­age of cases identified as having been caused by Plasmodium vivax (10.3%; n=6) in 2018 was the lowest observed during the 10-year surveillance period. The percentage of malaria cases attributed to P. falciparum (25.9 %) in 2018 was similar to that observed in 2017 (25.7%), although the number of cases increased. Malaria was diagnosed at or reported from 31 different medical facilities in the U.S., Afghanistan, Italy, Germany, Djibouti, and Korea. Pro­viders of medical care to military members should be knowledgeable of and vigilant for clinical manifestations of malaria outside of endemic areas.

Recommended Content:

Medical Surveillance Monthly Report

Outbreak of Acute Respiratory Illness Associated with Adenovirus Type 4 at the U.S. Naval Academy, 2016

Article
2/1/2019
Malaria case definition

Human adenoviruses (HAdVs) are known to cause respiratory illness outbreaks at basic military training (BMT) sites. HAdV type-4 and -7 vaccines are routinely administered at enlisted BMT sites, but not at military academies. During Aug.–Sept. 2016, U.S. Naval Academy clinical staff noted an increase in students presenting with acute respiratory illness (ARI). An investigation was conducted to determine the extent and cause of the outbreak. During 22 Aug.–11 Sept. 2016, 652 clinic visits for ARI were identified using electronic health records. HAdV-4 was confirmed by real-time polymerase chain reaction assay in 18 out of 33 patient specimens collected and 1 additional HAdV case was detected from hospital records. Two HAdV-4 positive patients were treated for pneumonia including 1 hospitalized patient. Molecular analysis of 4 HAdV-4 isolates identified genome type 4a1, which is considered vaccine-preventable. Understanding the impact of HAdV in congregate settings other than enlisted BMT sites is necessary to inform discussions regarding future HAdV vaccine strategy.

Recommended Content:

Medical Surveillance Monthly Report

Thyroid Disorders, Active Component, U.S. Armed Forces, 2008–2017

Article
12/1/2018
Cover 1

This analysis describes the incidence and prevalence of five thyroid disorders (goiter, thyrotoxicosis, primary/not otherwise specified [NOS] hypothyroidism, thyroiditis, and other disorders of the thyroid) among active component service members between 2008 and 2017. During the 10-year surveillance period, the most common incident thyroid disorder among male and female service members was primary/NOS hypothyroidism and the least common were thyroiditis and other disorders of thyroid. Primary/NOS hypothyroidism was diagnosed among 8,641 females (incidence rate: 43.7 per 10,000 person-years [p-yrs]) and 11,656 males (incidence rate: 10.2 per 10,000 p-yrs). Overall incidence rates of all thyroid disorders were 3 to 5 times higher among females compared to males. Among both males and females, incidence of primary/NOS hypothyroidism was higher among non-Hispanic white service members compared with service members in other race/ethnicity groups. The incidence of most thyroid disorders remained stable or decreased during the surveillance period. Overall, the prevalence of most thyroid disorders increased during the first part of the surveillance period and then either decreased or leveled off.31.6 per 100,000 active component service members in 2017. Validation of ICD-9/ICD-10 diagnostic codes for MetS using the National Cholesterol Education Program Adult Treatment Panel III criteria is needed to establish the level of agreement between the two methods for identifying this condition.

Recommended Content:

Medical Surveillance Monthly Report

Adrenal Gland Disorders, Active Component, U.S. Armed Forces, 2002–2017

Article
12/1/2018
Adrenal Gland Disorders, Active Component, U.S. Armed Forces, 2002–2017

During 2002–2017, the most common incident adrenal gland disorder among male and female service members was adrenal insufficiency and the least common was adrenomedullary hyperfunction. Adrenal insufficiency was diagnosed among 267 females (crude overall incidence rate: 8.2 cases per 100,000 person-years [p-yrs]) and 729 males (3.9 per 100,000 p-yrs). In both sexes, overall rates of other disorders of adrenal gland and Cushing’s syndrome were lower than for adrenal insufficiency but higher than for hyperaldosteronism, adrenogenital disorders, and adrenomedullary hyperfunction. Crude overall rates of adrenal gland disorders among females tended to be higher than those of males, with female:male rate ratios ranging from 2.1 for adrenal insufficiency to 5.5 for androgenital disorders and Cushing’s syndrome. The highest overall rates of adrenal insufficiency for males and females were among non-Hispanic white service members. Among females, rates of Cushing's syndrome and other disorders of adrenal gland were 31.6 per 100,000 active component service members in 2017. Validation of ICD-9/ICD-10 diagnostic codes for MetS using the National Cholesterol Education Program Adult Treatment Panel III criteria is needed to establish the level of agreement between the two methods for identifying this condition.

Recommended Content:

Medical Surveillance Monthly Report

Incidence and Prevalence of the Metabolic Syndrome Using ICD-9 and ICD-10 Diagnostic Codes, Active Component, U.S. Armed Forces, 2002–2017

Article
12/1/2018
Incidence and Prevalence of the Metabolic Syndrome Using ICD-9 and ICD-10 Diagnostic Codes, Active Component, U.S. Armed Forces, 2002–2017

This report uses ICD-9 and ICD-10 codes (277.7 and E88.81, respectively) for the metabolic syndrome (MetS) to summarize trends in the incidence and prevalence of this condition among active component members of the U.S. Armed Forces between 2002 and 2017. During this period, the crude overall incidence rate of MetS was 7.5 cases per 100,000 person-years (p-yrs). Compared to their respective counterparts, overall incidence rates were highest among Asian/Pacific Islanders, Air Force members, and warrant officers and were lowest among those of other/unknown race/ethnicity, Marine Corps members, and junior enlisted personnel and officers. During 2002–2017, the annual incidence rates of MetS peaked in 2009 at 11.6 cases per 100,000 p-yrs and decreased to 5.9 cases per 100,000 p-yrs in 2017. Annual prevalence rates of MetS increased steadily during the first 11 years of the surveillance period reaching a high of 38.9 per 100,000 active component service members in 2012, after which rates declined slightly to 31.6 per 100,000 active component service members in 2017. Validation of ICD-9/ICD-10 diagnostic codes for MetS using the National Cholesterol Education Program Adult Treatment Panel III criteria is needed to establish the level of agreement between the two methods for identifying this condition.

Recommended Content:

Medical Surveillance Monthly Report

2018 #ColdReadiness Twitter chat recap: Preventing cold weather injuries for service members and their families

Fact Sheet
2/5/2018

To help protect U.S. armed forces, the Armed Forces Health Surveillance Branch (AFHSB) hosted a live #ColdReadiness Twitter chat on Wednesday, January 24th, 12-1:30 pm EST to discuss what service members and their families need to know about winter safety and preventing cold weather injuries as the temperatures drop. This fact sheet documents highlights from the Twitter chat.

Recommended Content:

Medical Surveillance Monthly Report | Winter Safety | Medical and Dental Preventive Care Fitness | Health Readiness & Combat Support

Heat Illnesses by Location, Active Component, U.S. Armed Forces, 2012-2016 Fact Sheet

Fact Sheet
3/30/2017

This fact sheet provides details on heat illnesses by location during a five-year surveillance period from 2012 through 2016. 11,967 heat-related illnesses were diagnosed at more than 250 military installations and geographic locations worldwide. Three Army Installations accounted for close to one-third of all heat illnesses during the period.

Recommended Content:

Armed Forces Health Surveillance Division | Medical Surveillance Monthly Report

Demographic and Military Traits of Service Members Diagnosed as Traumatic Brain Injury Cases

Fact Sheet
3/30/2017

This fact sheet provides details on the demographic and military traits of service members diagnosed as traumatic brain injury (TBI) cases during a 16-year surveillance period from 2001 through 2016, a total of 276,858 active component service members received first-time diagnoses of TBI - a structural alteration of the brain or physiological disruption of brain function caused by an external force.

Recommended Content:

Armed Forces Health Surveillance Division | Medical Surveillance Monthly Report

Rhabdomyolysis by Location, Active Component, U.S. Armed Forces, 2012-2016 Fact Sheet

Fact Sheet
3/30/2017

This fact sheet provides details on Rhabdomyolysis by location for active component, U.S. Armed Forces during a five-year surveillance period from 2012 through 2016. The medical treatment facilities at nine installations diagnosed at least 50 cases each and, together approximately half (49.9%) of all diagnosed cases.

Recommended Content:

Armed Forces Health Surveillance Division | Medical Surveillance Monthly Report
<< < ... 11 12 13 14 > >> 
Showing results 196 - 208 Page 14 of 14
Refine your search
Last Updated: October 31, 2022
Follow us on Instagram Follow us on LinkedIn Follow us on Facebook Follow us on Twitter Follow us on YouTube Sign up on GovDelivery