Abstract
As the most frequently reported vector-borne disease among active component U.S. service members, with an incidence rate of 16 cases per 100,000 person-years in 2011, Lyme disease poses both a challenge to health care providers in the Military Health System and a threat to military readiness. Spread through the bite of an infected blacklegged tick, infection with the bacterial cause of Lyme disease can have lasting effects that may lead to medical discharge from the military. The U.S. Military Academy at West Point is situated in a highly endemic area in New York State. To identify probable areas where West Point cadets as well as active duty service members stationed at West Point and their families might contract Lyme disease, this study used Geographic Information System mapping methods and remote sensing data to replicate an established spatial model to identify the likely habitat of a key host animal—the white-tailed deer.
What Are the New Findings?
This study used an established spatial analysis method to determine likely high-risk areas for contracting Lyme disease from ticks (Ixodes scapularis) near West Point, NY. Urban population centers in this area have lower habitat suitability values for white-tailed deer, the tick's host, while rural areas and military training grounds have higher suitability values.
What Is the Impact on Readiness and Force Health Protection?
Lyme disease, if not diagnosed early, can result in post-treatment Lyme disease syndrome (PTLDS). The symptoms resulting from Lyme disease and possible PTLDS may render service members non-deployable and may result in medical separations from service. Military bases in endemic areas need to increase awareness of the local Lyme disease threat and facilitate the implementation of superior tick bite prevention measures.
Background
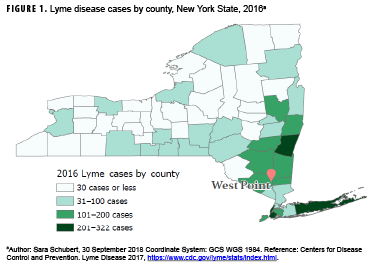
Lyme disease (LD) is the most frequently reported vector-borne disease in the U.S., with over 36,429 confirmed and probable cases in 2016.1 The vast majority of LD cases are reported from 14 states in the Northeast and Upper Midwest.2 New York State alone accounted for 11.4% and 10.0% of confirmed cases nationally in 2015 and 2016, respectively.3 Moreover, Southeastern NY—an area that includes the U.S. Military Academy (USMA) at West Point that is home to over 4,400 cadets and 4,200 active duty service members (ADSMs) and their families—has the highest burden of LD (Figure 1). One study reported that ticks in Southeastern NY had infection rates as high as 55% for the bacterial cause of LD.4
In the past few years, LD has resulted in the removal of at least 2 cadets from the USMA because of medical ineligibility for commissioning. In addition, 2 recently commissioned Second Lieutenants have been discharged from the Army because of medical issues as a result of chronic LD. Further research on the prevalence of LD at West Point as well as the diagnostic accuracy of techniques employed there is ongoing. Results of these studies may increase the need for identification of high-risk areas within the reservation and the surrounding area.
Cases of LD in humans are a result of several factors (e.g., vectors and reservoir hosts) that facilitate the transmission of the causative bacterium (Borrelia burgdorferi) to humans. The most common vector of B. burgdorferi in the Northeastern U.S. is Ixodes scapularis, commonly known as the blacklegged tick or deer tick.5 While Ixodes spp larvae and nymphs prefer small mammalian hosts, including the white-footed mouse (a competent reservoir for B. burgdorferi),6,7 adult ticks prefer white-tailed deer (a less competent host of this bacterium).8,9
There are few methods to determine tick density in a given area. One common method, tick dragging, was used at West Point in 2016 and showed that B. burgdorferi-infected ticks were found in both military family housing neighborhoods and cadet training areas. (The housing area for cadets was not tested since it consisted of impervious surfaces and thus was not a likely tick habitat).10 While tick dragging can locate B. burgdorferi-infected ticks, this technique is limited by its time intensive nature, the difficulty in finding and extracting the small tick larvae and nymphs from the drag cloth, and its susceptibility to weather and temperature conditions.11 These limitations of tick dragging demonstrate the need for improved tick habitat prediction.
To address these limitations, some studies have used spatial analysis and predictive modeling for LD vectors and have focused on a variety of variables including soil type, vegetation, small mammal abundance, temperature, humidity, geology, and predator abundance.8,12–16 However, these studies have produced conflicting results, which may be due to confounding effects of various geographic factors, including inconsistencies such as a positive correlation between tick abundance and precipitation in areas with soils that drain quickly (such as sand) and a negative correlation between tick abundance and precipitation in areas with soils that drain slowly (such as clay).5 Studies of tick tree preferences also have demonstrated inconsistent findings.12,17 Thus, it is difficult to pinpoint the environmental preferences of I. scapularis without the implementation of a control habitat and/or standardization of data capture across multiple studies.
Some studies also have focused on host animal habitats in order to estimate the spatial distribution of I. scapularis. Results of studies regarding the importance of host animals in LD and I. scapularis ecology are mixed.18,19 However, studies agree that deer are an important part of the ecology and contribute to the continued spread of this disease.17,20 In light of this, Chen et al. used Geographic Information System (GIS) mapping methods combined with spatial analysis techniques to create a habitat suitability model for white-tailed deer in Ontario, Canada.9 The results of this study demonstrated that high suitability areas for white-tailed deer corresponded with high tick abundance.9
At the time of this report, no studies have examined white-tailed deer habitat suitability at West Point. The current study addresses this gap by using open data in a model similar to that employed by Chen et al. to identify the LD risk for West Point cadets, ADSMs, and their families.
Methods
Study area
The USMA at West Point is located in Orange County, which is situated on the Hudson River in upstate NY. This area is semi-rural, heavily wooded, and relatively mountainous, with the highest peak rising 1,664 feet above the Hudson River.21
Data sources
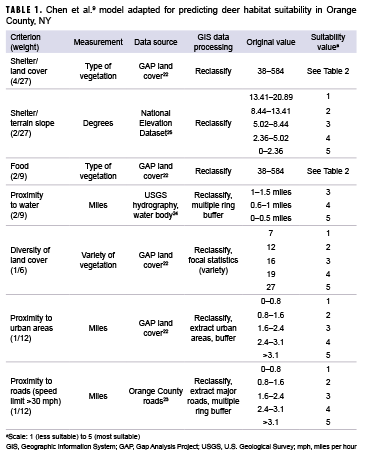
To determine the most likely geographic distribution of blacklegged ticks and the resulting areas of potentially high LD prevalence, Chen and colleagues' model for deer habitat suitability was replicated using open data for Orange County. The model sought to determine where deer have the best access to shelter (i.e., land cover and terrain slope), food (i.e., vegetation type), water, diversity of land cover, and proximity to urban areas and roads (i.e., suitability criteria). Data on vegetation and land use patterns were obtained from the U.S. Geological Survey's (USGS's) National Gap Analysis Project (GAP) Land Cover dataset, which represents vegetation and land use patterns for the continental U.S. derived from 1999–2001 Landsat Thematic Mapper satellite imagery.22 Data on all roads in Orange County were obtained from the Orange County GIS Division.23 Water body data were obtained from the USGS's National Hydrography Dataset in the form of a vector dataset (i.e., representation using points, lines, and polygons); these data were publicly available for the contiguous U.S. at a scale of 1:24,000 or better.24 Data needed to calculate the slope of the terrain were obtained from USGS's National Elevation Dataset in raster form (i.e., representation as a surface divided into a grid of cells) with a resolution of approximately 10 meters (one-third arc-second).25
Data processing and analysis
To transform the 4 datasets outlined above into a single habitat suitability layer, each dataset was reclassified using a scale from 1 (less suitable) to 5 (most suitable) using ArcGIS Pro software, version 2.1.2 (2018, ESRI, Redlands, CA). The 7 suitability criteria used in the analysis are shown in Table 1.
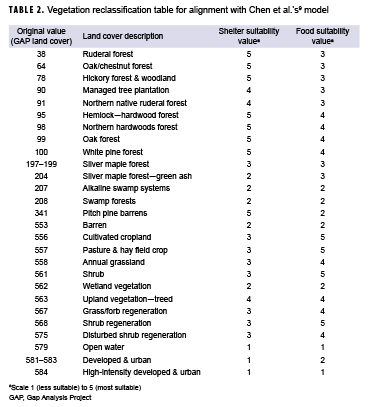
To determine the suitability of the vegetation for the shelter and food layers, the original GAP land cover values were reclassified to the coordinating suitability values from Chen and colleagues' model.9 These values are presented in Table 2. The terrain slope also contributed to shelter suitability. Relatively flat areas were classified as most suitable, while steeper slopes were classified as less suitable. Chen and colleagues' analysis used a maximum distance of 1 mile to water for a suitability rating of 5; however, because of the abundance of water in Orange County, a maximum distance of 1 mile from a water body covered over 95% of the county. To better determine suitability, distances of 0.5 miles, 1 mile, and 1.5 miles were used to create the buffers. Similarly, multiple ring buffers were used for roads and urban areas. To determine the diversity of the land cover, the ArcGIS Pro focal statistics tool was used to determine the variety of cells within a circle with a 0.5 mile radius; resulting values were reclassified to the 1 to 5 suitability values, with higher vegetative diversity receiving a value of 5. Once each dataset layer was reclassified to the appropriate suitability values, vector data were converted to raster in order to calculate the suitability layer. These layers were then combined using a weighted sum to create 1 layer with an overall habitat suitability as follows: habitat suitability = land cover (shelter) * 0.148 + terrain slope (shelter) * 0.074 + vegetation (food) * 0.220 + proximity to water * 0.220 + diversity of land cover (shelter) * 0.167 + proximity to urban areas * 0.083 + proximity to roads * 0.083.
Results
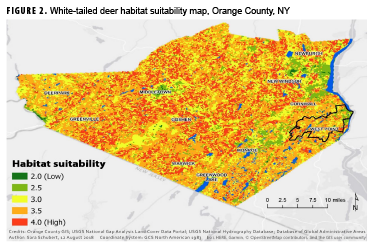
Figure 2 shows the map resulting from the final suitability analysis for white-tailed deer habitats within Orange County. Areas in shades of yellow and green are less suitable for deer and, as a result, are less likely to be areas where humans will contract LD. Conversely, areas in orange and red are more suitable habitats for white-tailed deer and are presumably areas where humans are more likely to encounter the blacklegged tick and contract LD. Areas around the cities of Newburgh, Middletown, and Monroe appear to be primarily green (unsuitable deer habitat). Urban population centers with reduced green space, increased density of roads, and continuous vehicular traffic offer reduced food and shelter for white-tailed deer, resulting in lower suitability values. Because water is prevalent throughout Orange County, its effect on habitat suitability was not pronounced. There were few areas further than 1.5 miles from a water body, which resulted in the entire county having suitability values that ranged between 2 and 4. The large uniform yellow area to the southwest of Goshen stands out from the uneven texture of the rest of the county. This area contains the Wallkill River and large stretches of cropland, which is only moderately suitable for deer given the shelter suitability value of 3. Additionally, Highway 26 runs the length of this section, keeping suitability values relatively low overall.
The pixel size for GAP land cover data is 30 meters, which makes it difficult to look specifically at West Point within Orange County (Figure 2). However, zooming in on this portion of the map reveals that the training areas, where cadets spend the majority of their summers, contain several habitats with medium to high suitability for white-tailed deer. The main garrison, located in the northeast portion of the reservation, is primarily green and yellow (low suitability). This region is where cadets spend the majority of their time during the academic year and also where ADSMs and family members reside.
Editorial Comment
As the most frequently reported vectorborne disease in the U.S., with an incidence rate of 16 cases per 100,000 person-years among active component service members in 2011, LD poses both a challenge to health care providers in the Military Health System and a threat to military readiness.26 LD, if not diagnosed early, can result in post-treatment LD syndrome (PTLDS). The symptoms resulting from LD and possible PTLDS may render service members non-deployable and may result in medical separations from service.
Research focused specifically on LD among ADSMs and their families on military reservations has found that family members were affected at a higher rate than service members.27 Analysis of the U.S. Army's Public Health Command Human Tick Test Kit Program data revealed a similar finding that only 23% of the ticks submitted to the program were removed from ADSMs.28 Additionally, this study demonstrated that the crude overall incidence of LD increased with both age and rank. The positive correlation between LD incidence and age is also seen in the civilian population.29 However, the association of higher incidence with higher rank seems contrary to the assumption that spending greater amounts of time outdoors escalates the risk for LD and other tick-borne diseases.20 This discrepancy may be due, at least in part, to an assumption that LD is primarily contracted peridomestically (around human habitations). This assumption is not unique to military-specific studies and is generally difficult to confirm without additional data from patients.5,20,30 Socio-cultural factors also may explain this discrepancy. ADSMs are provided a uniform treated with permethrin and are ordinarily instructed on vector-control measures, such as tucking pants into boots and conducting tick checks.7,27,31 These public health prevention measures may assist in decreasing LD cases among ADSMs; however, additional data are needed to determine the effectiveness of these measures.
The finding of low suitability around the main garrison is contradictory to the assumption that LD is primarily contracted near domestic areas; however, as noted in other peridomestic studies, further research examining human behavior in conjunction with ecologic risk is warranted.20 Higher resolution land cover data for the entire West Point reservation could increase the accuracy of predicting deer habitat and allow for improved identification of areas where the risk of exposure to LD-infected ticks is high.
There are important limitations to consider when interpreting the results of the current study. First, because the cell resolution (30 meters) of the dataset employed in the analysis was so much greater than the minimum mapping unit area (1 acre), some generalization of land cover was required, which may have created bias within the analysis where vegetation patches were too small to be properly coded. However, this bias is most likely non-differential since both suitable and non-suitable deer habitats were equally likely to be missed during the aggregation. Second, the current study did not incorporate information on deer density or density of B. burgdorferi-positive I. scapularis on the military reservation. Identifying an association between the deer habitat suitability values and deer and/or tick density would have suggested that the habitat and environmental conditions of the white-tailed deer may also impact the abundance of the tick.
While the current spatial analysis did not provide a high-resolution mapping of habitat suitability for deer within the West Point reservation, the lower resolution map did provide some insight into variations in habitat suitability for deer (the I. scapularis host) within and around the reservation, an area of high LD prevalence. Further analysis of where LD cases acquire their tick bites could enhance the spatial analysis method used here. Moreover, the analysis method could be used to generate maps of deer habitat suitability in other counties or parts of the country. All of the data for this study were publicly accessible, with the majority available on a national level, making this type of suitability map easy to generate for various areas within the U.S. These maps may then be used to increase awareness of LD, the factors leading to this disease, and the proper prevention techniques, including vector control and preventive measures. When combined with higher spatial resolution data, this mapping method could provide the more detailed spatial analysis necessary for better implementation of vector control programs and targeted promotion of LD awareness and prevention.
Author affiliations: Keller Army Community Hospital, West Point, NY (CPT Schubert); Keck School of Medicine, University of Southern California (CPT Schubert); U.S. Military Academy, West Point, NY (LTC Melanson); U.S. Army Medical Research Institute of Infectious Diseases, Fort Detrick, MD (LTC Melanson)
Ackowledgment: The authors thank Jennifer Moore Bernstein (PhD), Lecturer, Spatial Sciences Institute, University of Southern California Dornsife College of Letters, Arts and Sciences for her review of the initial spatial analysis. They also thank LTC Jason Barnhill, Academy Professor in the Chemistry and Life Science Department of U.S. Military Academy, West Point, for introducing and inspiring them to pursue tick-related research.
Disclaimer: The contents, views, or opinions expressed in this publication are those of the author(s) and do not necessarily reflect the official policy or position of the Department of Defense (DOD) or the Department of the Army.
References
- Centers for Disease Control and Prevention. Lyme Disease. Lyme disease charts and figures: historical data. Reported cases by year, United States, 1997–2017. https://www.cdc.gov/lyme/stats/graphs.html. Accessed 19 Feb. 2018.
- Schwartz AM, Hinckley AF, Mead PS, Hook SA, Kugeler KJ. Surveillance for Lyme Disease—United States, 2008–2015. MMWR Surveill Summ. 2017;66(22):1–12.
- Centers for Disease Control and Prevention. Lyme Disease. Lyme disease data tables: historical data. Reported cases of Lyme disease by state or locality, 2007–2017. https://www.cdc.gov/lyme/stats/tables.html. Accessed 25 Feb. 2018.
- Aliota MT, Dupuis AP, Wilczek MP, Peters RJ, Ostfeld RS, Kramer LD. The prevalence of zoonotic tick-borne pathogens in Ixodes scapularis collected in the Hudson Valley, New York State. Vector Borne Zoonotic Dis. 2014;14(4):245–250.
- Killilea ME, Swei A, Lane RS, Briggs CJ, Ostfeld RS. Spatial dynamics of Lyme disease: a review. EcoHealth. 2008;5(2):167–195.
- Barbour AG, Fish D. The biological and social phenomenon of Lyme disease. Science. 1993;260(5114):1610–1616.
- Armed Forces Pest Management Board. Tickborne diseases: vector surveillance and control. https://www.acq.osd.mil/eie/afpmb/docs/techguides/tg26.pdf. Published November 2012. Accessed 20 Feb. 2018.
- Ostfeld RS, Canham CD, Oggenfuss K, Winchcombe RJ, Keesing F. Climate, deer, rodents, and acorns as determinants of variation in Lyme-disease risk. PLoS Biol. 2006;4(6):e145.
- Chen D, Wong H, Belanger P, Moore K, Peterson M, Cunningham J. Analyzing the correlation between deer habitat and the component of the risk for Lyme disease in Eastern Ontario, Canada: a GIS-based approach. ISPRS Int J Geoinf. 2015;4(1):105–123.
- Butler JJ. Vector-borne disease surveillance report, USMA, West Point, NY, November 2016. Public Health Command—Atlantic; 2017.
- Ontario Agency for Health Protection and Promotion (Public Health Ontario). Active tick dragging: standard operating procedure. https://www.publichealthontario.ca/-/media/documents/sop-active-tick-dragging.pdf?la=en. Published November 2015. Accessed 23 February 2018.
- Guerra M, Walker E, Jones C, et al. Predicting the risk of Lyme disease: habitat suitability for Ixodes scapularis in the North Central United States. Emerg Infect Dis. 2002;8(3):289–297.
- Ostfeld RS, Levi T, Keesing F, Oggenfuss K, Canham CD. Tick-borne disease risk in a forest food web. Ecology. 2018;99(7):1562–1573.
- Johnson TL, Bjork JKH, Neitzel DF, Dorr FM, Schiffman EK, Eisen RJ. Habitat suitability model for the distribution of Ixodes scapularis (Acari: Ixodidae) in Minnesota. J Med Entomol. 2016;53(3):598–606.
- Estrada-Peña A. Increasing habitat suitability in the United States for the tick that transmits Lyme disease: a remote sensing approach. Environ Health Perspect. 2002;110(7):635–640.
- Eisen RJ, Eisen L, Lane RS. Predicting density of Ixodes pacificus nymphs in dense woodlands in Mendocino County, California, based on Geographic Information Systems and remote sensing versus field-derived data. Am J Trop Med Hyg. 2006;74(4):633–640.
- Ostfeld RS, Cepeda OM, Hazler KR, Miller MC. Ecology of Lyme disease: habitat associations of ticks (Ixodes scapularis) in a rural landscape. Ecol Appl. 1995;5(2):353–361.
- Rand PW, Lubelczyk C, Holman MS, Lacombe EH, Smith RP. Abundance of Ixodes scapularis (Acari: Ixodidae) after the complete removal of deer from an isolated offshore island, endemic for Lyme disease. J Med Entomol. 2004;41(4):779–784.
- Kugeler KJ, Jordan RA, Schulze TL, Griffith KS, Mead PS. Will culling white-tailed deer prevent Lyme disease? Zoonoses Public Health. 2016;63(5):337–345.
- Raizman EA, Holland JD, Shukle JT. Whitetailed deer (Odocoileus virginianus) as a potential sentinel for human Lyme disease in Indiana. Zoonoses Public Health. 2013;60(3):227–233.
- United States Geological Survey. Geographic Names Information System (GNIS). Feature detail report for: Schunnemunk Mountain. https://geonames.usgs.gov/apex/f?p=gnispq:3:0::NO::P3_FID:964627. Accessed 5 September 2018.
- United States Geological Survey. Gap Analysis Project (GAP), Land Cover Data Portal. https://gapanalysis.usgs.gov/gaplandcover/data. Accessed 21 March 2018.
- Orange County GIS Division. Orange County Roads dataset. October 2017. http://ocgis.orangecountygov.com/requests/showPage.xsp;jsessionid=F8D33B44DE75F92BF4BDBAF448A0BBDF?page=home. Accessed 21 April 2018.
- United States Geological Survey. National Hydrography Dataset (NHD) Best Resolution. https://www.usgs.gov/core-science-systems/ngp/national-hydrography/national-hydrography-dataset?qtscience_support_page_related_con=0#qt-science_support_page_related_con. Accessed 30 September 2018.
- United States Geological Survey. USGS NED 1/3 arc-second n42w075 1 x 1 degree Arc-Grid 2016. https://www.sciencebase.gov/catalog/item/581d216be4b08da350d532be. Accessed 30 September 2018.
- Armed Forces Health Surveillance Center. Surveillance snapshot: Lyme disease among beneficiaries of the Military Health System, 2001–2012. MSMR. 2013;20(8):23.
- Anna MM, Escobar JD, Chapman AS. Reported vectorborne and zoonotic diseases, U.S. Air Force, 2000–2011. MSMR. 2012;19(10):11–14.
- Rossi C, DeFraites RF. Characterizing the relationship between tick bites and Lyme disease in active component U.S. Armed Forces in the Eastern United States. MSMR. 2015;22(3):2–10.
- Garcia MN, Cropper TL, Gunter SM, Roachell W, Ronca SE, Stidham RA. Vector-borne diseases of public health importance for personnel on military installations in the United States. US Army Med Dep J. 2017;Jan.–June(1–17):90–101.
- Connally NP, Ginsberg HS, Mather TN. Assessing peridomestic entomological factors as predictors for Lyme disease. J Vector Ecol. 2006;31(2):364–370.
- Connally NP, Durante AJ, Yousey-Hindes KM, Meek JI, Nelson RS, Heimer R. Peridomestic Lyme disease prevention: results of a population-based case–control study. Am J Prev Med. 2009;37(3):201–206.