What are the New Findings?
During the first 6 months of the COVID-19 pandemic, health care utilization for mental and behavioral health generally declined during March and April but rebounded by June 2020. During the same period, telehealth usage increased during the early pandemic and was on average 25% higher during the period between March and September 2020 as compared to the previous year.
What is the Impact on Readiness and Force Health Protection?
During the first 6 months of the COVID-19 pandemic, health care utilization for mental and behavioral health generally declined during March and April but rebounded by June 2020. During the same period, telehealth usage increased during the early pandemic and was on average 25% higher during the period between March and September 2020 as compared to the previous year.
Abstract
This analysis of population-level health care utilization data evaluates changes in monthly counts and rates of medical encounters for mental and behavioral health (MH/BH) conditions and the proportion of care delivered via telehealth among active component military members of the U.S. Armed Forces during the first 6 months (March–September 2020) of the COVID-19 pandemic. Comparisons are also made to the same time period in the previous year (2019). Telehealth usage increased during the early pandemic and was on average 25% higher during March–September 2020 as compared to the previous year. In contrast, MH/BH outpatient visit rates declined modestly between March and May 2020 before rebounding in June and remaining stable through September 2020. The number of bed days attributable to MH/BH conditions also declined during March and April 2020 and was on average 30% lower during March–September 2020 as compared to the same period in the prior year. Continued surveillance is warranted to track MH/BH health care utilization during the later months of the pandemic to ensure that sufficient resources continue to be directed towards MH/BH care to support the health and readiness of active component service members.
Background
The World Health Organization declared the spread of coronavirus disease (COVID-19) an international pandemic on March 11, 2020. Subsequently, 2 national emergency declarations related to the pandemic were issued in the U.S. on March 13. Between 1 March and 31 May 2020, 42 U.S. states and territories issued mandatory stay-at-home orders as a mitigation strategy to reduce the spread of COVID-19.1 The resulting unprecedented and multi-dimensional disruptions to daily life contributed to social isolation, fear and worry about being infected with COVID-19, economic stress, and other factors which can affect mental and behavioral health (MH/BH).
Multiple studies have reported on the negative MH impacts of the pandemic. A systematic review revealed elevated rates of stressors and symptoms of anxiety and depression across 8 countries during the pandemic as compared to the prior year.2 In the U.S., the Centers for Disease Control and Prevention (CDC) reported considerable increases in symptoms of anxiety and depressive disorders between April and June of 20203,4 and elevated rates of suicidal ideation, substance abuse, and other adverse mental health conditions in June 20205 when compared to the previous year.
Concomitant with these negative consequences, the COVID-19 pandemic forced many health care institutions to embrace the use of telehealth to efficiently provide quality care to patients. Several large health care systems in the U.S. reported dramatic increases in the use of telehealth with commensurate declines for in-person medical care.6–8 In addition to the overall shift from in-person to telehealth medical services, health care systems reported increased use of telehealth specifically for mental health care. For example, the U.S. Department of Veterans Affairs experienced an increase of over 500% in telehealth visits for mental and behavioral health care between 11 March and 22 April 2020.9 Similar patterns for MH/BH visits and telehealth were observed among TRICARE beneficiaries during the COVID-19 pandemic as compared to the same time period in 2019.10
However, estimates of the magnitude of change in the utilization of MH/BH health care and telehealth use by active component members of the U.S. Armed Forces have not been published. This surveillance analysis of population-level health care utilization data evaluates changes in monthly counts and rates of medical encounters for MH/BH conditions among active component military members of the U.S. Armed Forces during the first 6 months (March–September 2020) of the COVID-19 pandemic. This analysis also assesses and reports the proportion of MH/BH encounters delivered via telehealth during the surveillance period. Finally, counts and rates of MH/BH encounters during the first 6 months of the pandemic are compared to the same time period in the previous year (2019).
Methods
The surveillance period for this analysis was 1 January 2019 through 30 September 2020. This retrospective surveillance analysis evaluated health care utilization for MH/BH conditions including outpatient encounters, hospitalizations, and telehealth usage for all active component service members in the U.S. Army, Navy, Air Force, and Marine Corps during the surveillance period. The data used in this analysis were derived from administrative medical records routinely maintained in the Defense Medical Surveillance System (DMSS) consisting of encounters rendered at military treatment facilities (MTFs) and civilian facilities if reimbursed through the Military Health System (MHS) worldwide.
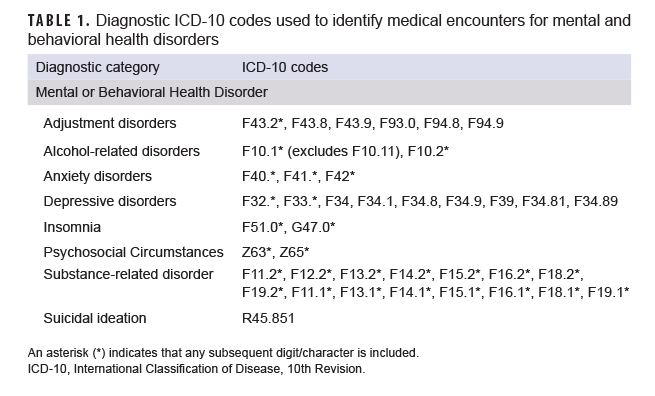
For the surveillance period, monthly summaries of health care utilization for specific MH/BH conditions were quantified using methods consistent with those used in the annual Medical Surveillance Monthly Report (MSMR) burden analysis.11 Standard surveillance case definitions developed by the Armed Forces Health Surveillance Division were used to identify International Classification of Diseases, 10th Revision (ICD-10) codes corresponding to the MH/BH conditions of interest (Table 1). All medical encounters for active component service members with an ICD-10 code for a MH/BH condition of interest in the primary (first-listed) diagnostic position were identified. The specific MH/BH conditions evaluated for this analysis included the following: adjustment disorders, alcohol-related disorders, anxiety disorders, depressive disorders, substance-related disorders, suicidal ideation, psychosocial circumstances (e.g., problems related to family circumstances; problems related to other psychosocial circumstances), and insomnia. ICD-10 code F10.11 was not included because this code represents alcohol abuse in remission. Although not specifically a MH/BH diagnosis, insomnia was included in this analysis as it is a common comorbidity with other MH/BH conditions and increases in the frequency of sleep problems have been reported during the COVID-19 pandemic.12
Telehealth encounters were defined as outpatient encounters that contained a Current Procedural Terminology (CPT) code for a telehealth encounter (i.e., health care delivered via telephone or video) or that were coded as a telehealth encounter in a DMSS variable identifying appointment type.
All medical encounters identified using the criteria specified above were included in this analysis and no sampling strategy was utilized. Because this analysis represents population-level data and the goal of the analysis was not to generalize these findings to other populations or time periods, no inferential statistics were employed.13
Counts of outpatient medical encounters, the number of unique individuals receiving care, and the numbers of bed days were calculated and reported for each month of the surveillance period for MH/BH conditions overall and for each specific MH/BH condition assessed. Monthly MH/BH outpatient encounter rates were calculated by dividing the number of outpatient encounters (including telehealth encounters) in a given month by the number of service members serving at least 1 day during that month and reported as the number of encounters per 100 service members. The number of bed days attributable to insomnia and psychological circumstances were not reported because there were few hospitalizations for these conditions.
Results
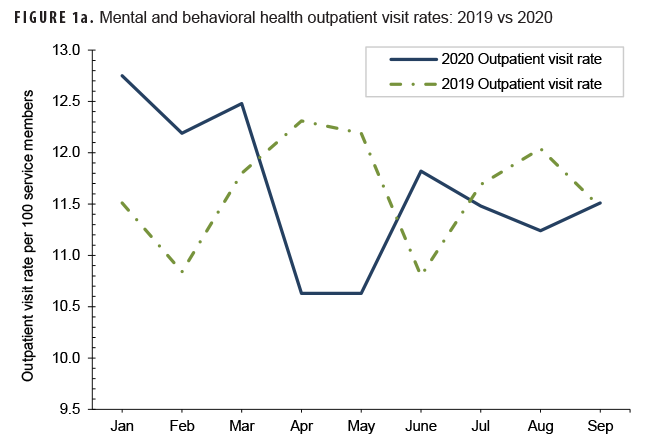
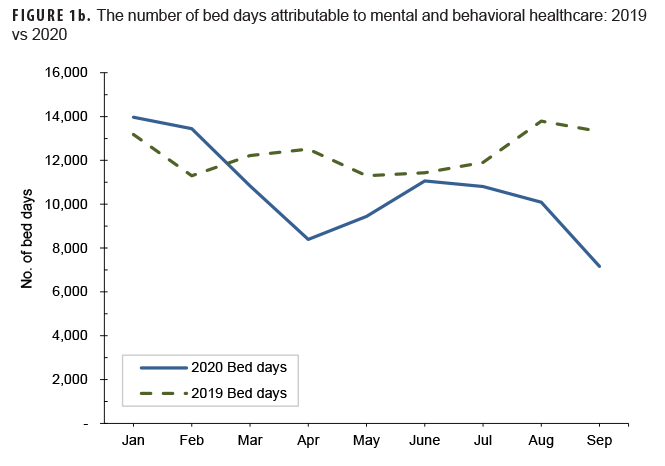
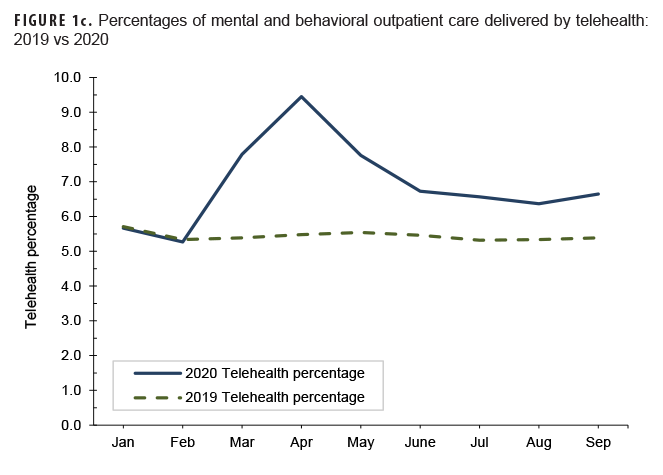
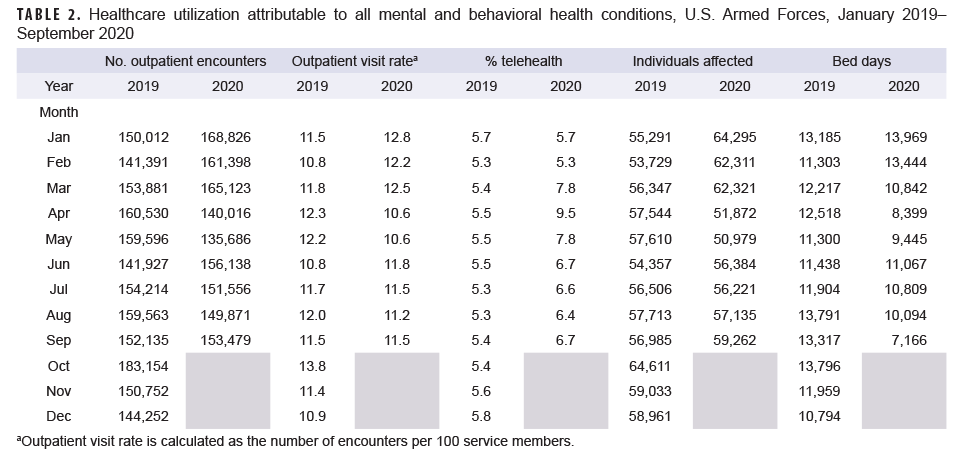
During January and February 2020 (the months prior to the declaration of the pandemic), the MH/BH outpatient visit rate and the number of bed days attributable to MH/BH conditions averaged 12 and 13% higher, respectively, than in the same period in the previous year. (Table 2, Figures 1a, 1b). In contrast, telehealth usage during this period was similar (approximately 1% lower) to the same period in 2019 (Table 2, Figure 1c). During March 2020, the MH/BH outpatient visit rate remained 6% higher than in 2019 (Table 2, Figure 1a). However, the number of bed days attributable to MH/BH conditions during March 2020 (n=10,842) represented a 19% decrease from February 2020 and an 11% decrease compared to February 2019 (Table 2).
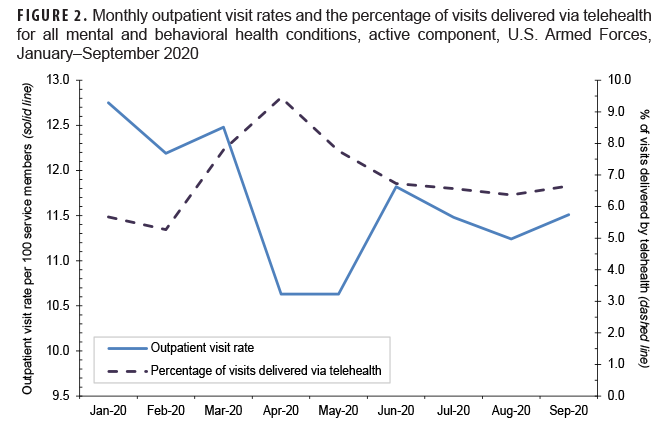
Between March and April 2020, the outpatient visit rate for MH/BH encounters declined by 15% to 10.6 visits per 100 service members; this outpatient visit rate was stable through May (Table 2, Figure 2). During this same period, the percentage of outpatient encounters delivered via telehealth increased an additional 22%, after increasing 48% between February and March 2020.
By June 2020, the declining trend in health care utilization for MH/BH conditions reversed with an 11% increase in the outpatient visit rate to 11.8 encounters per 100 service members (Table 2, Figure 2). Similarly, the number of bed days attributable to MH/BH conditions increased by 17% in June as compared to the prior month (Table 2). In contrast, from May through June 2020, telehealth usage declined by 14%.
During the remainder of the surveillance period (July–September 2020), the outpatient visit rate was relatively stable and varied by 3% or less while the number of bed days attributable to MH/BH conditions declined in each remaining month of the surveillance period (Table 2, Figure 2). Overall, the number of bed days attributable to all MH/BH conditions in September was 29% lower than in August and 46% lower than in September of the prior year.
Telehealth use for MH/BH conditions peaked in April 2020. Subsequently, telehealth use declined during May–August 2020 although telehealth use remained consistently higher every month between March and September 2020 than during the same period in the prior year (2019) (Figure 1c).
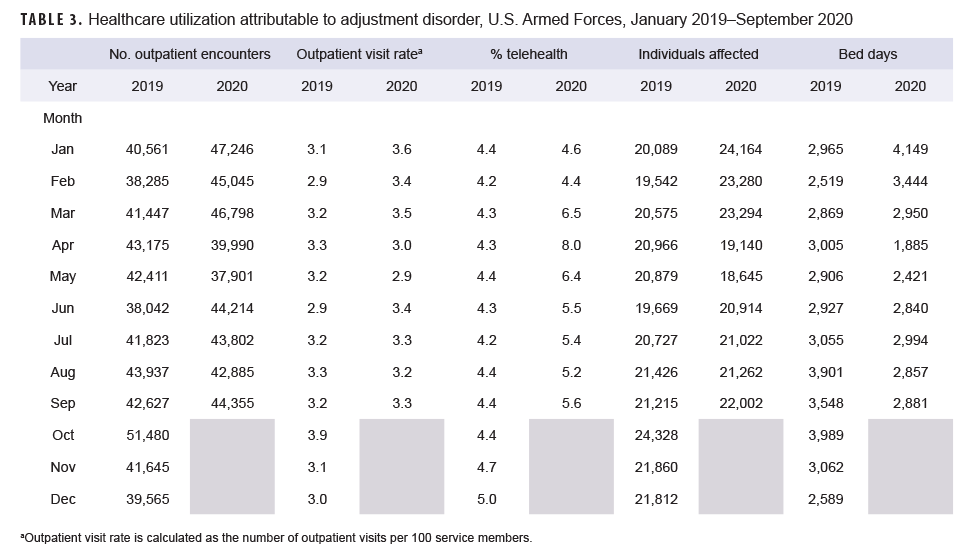
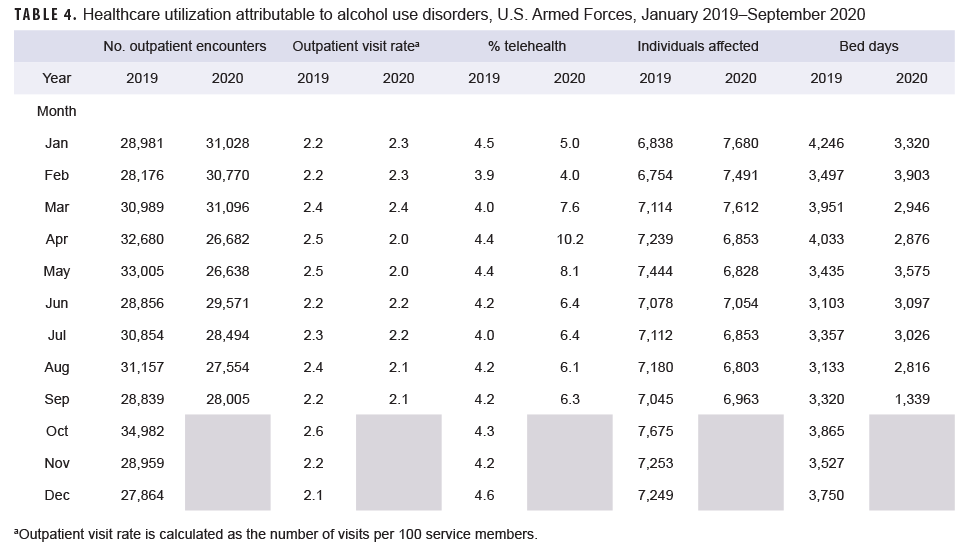
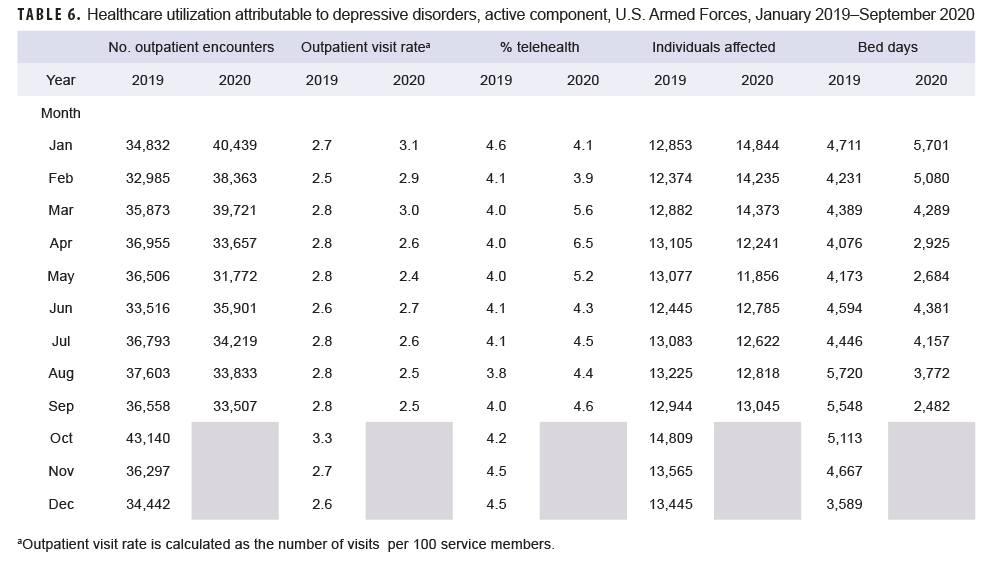
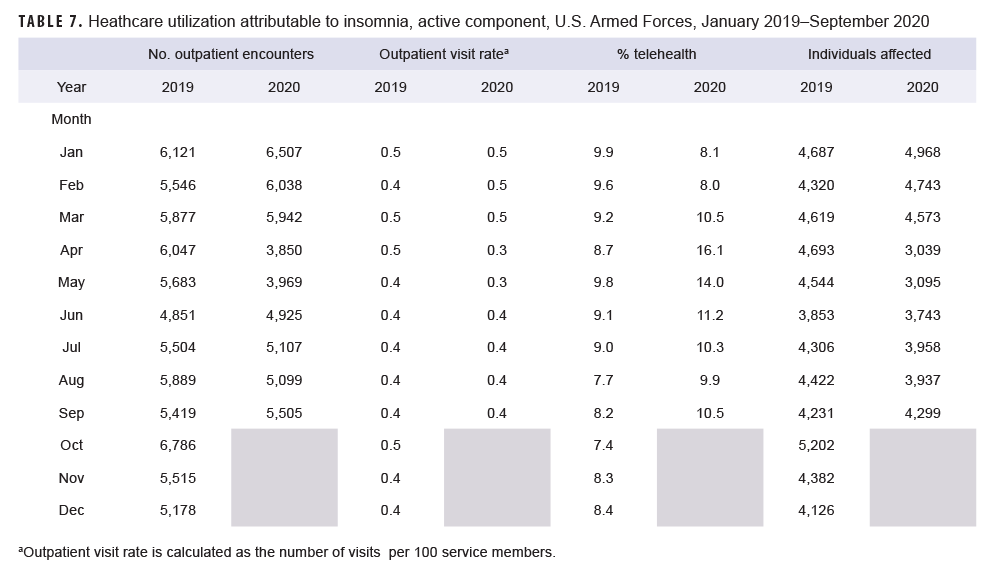
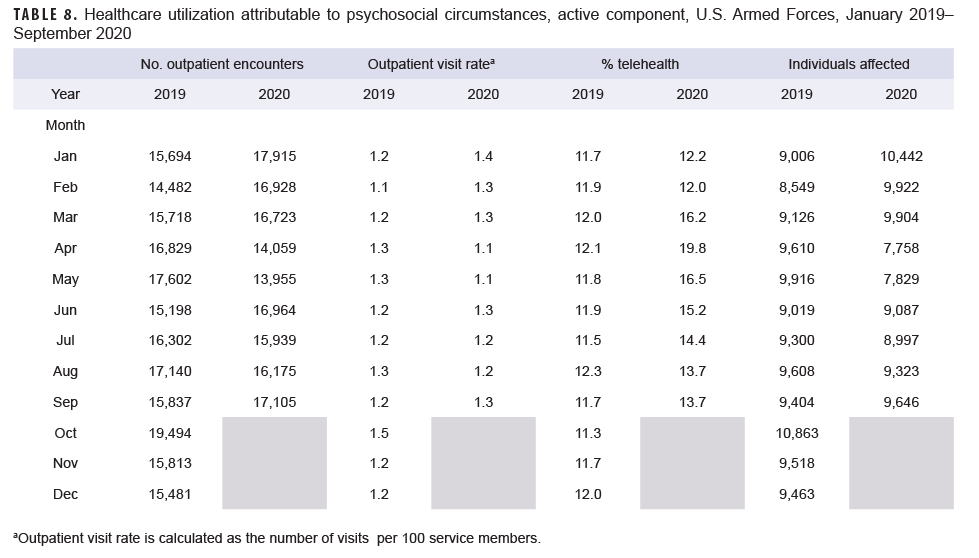
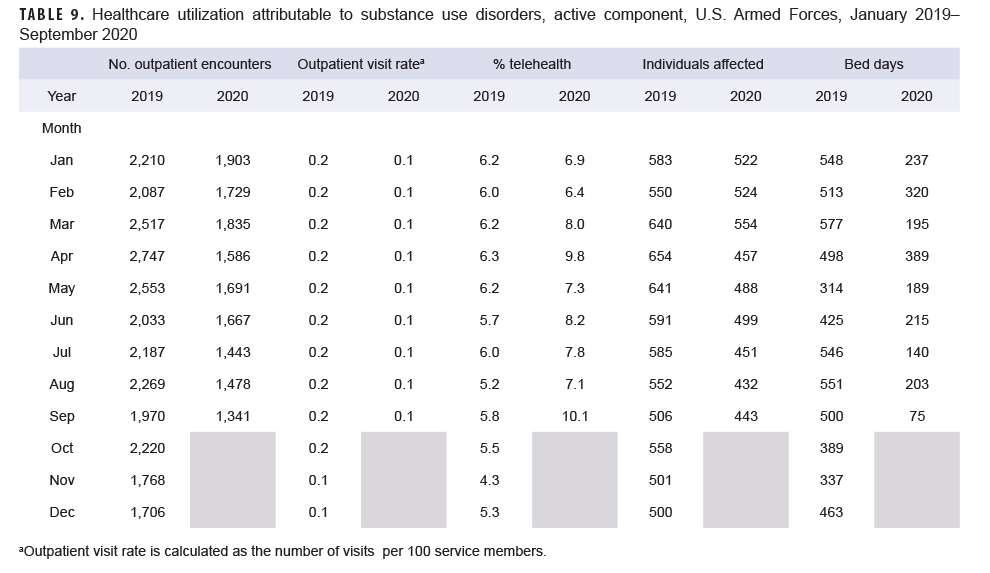
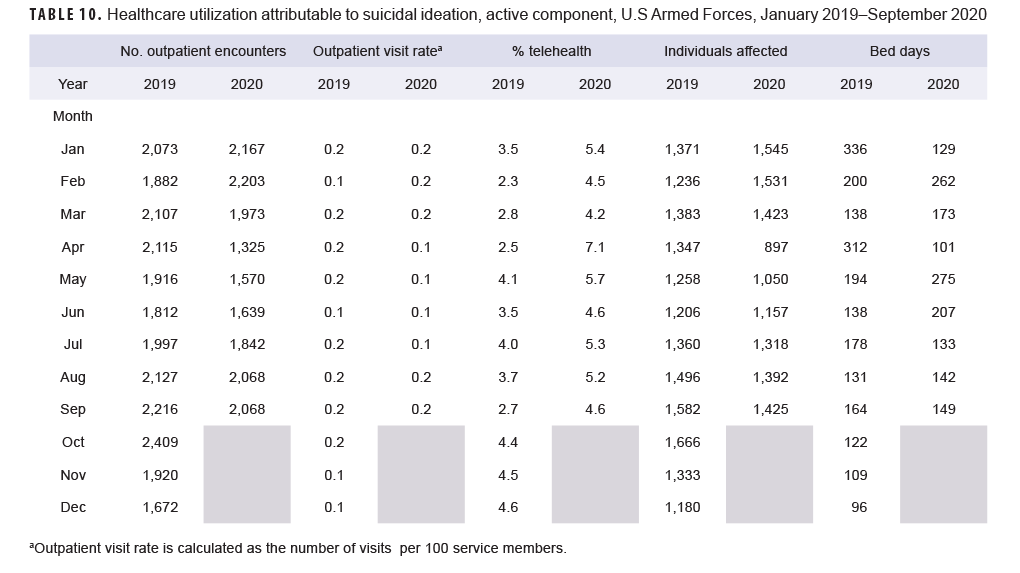
Generally, patterns of health care utilization for specific MH/BH conditions (e.g., adjustment disorders, anxiety disorders, depressive disorders) were similar to patterns identified in the summary of conditions overall (Tables 3–10 [See Appendix]). For example, all conditions included in this analysis except insomnia, psychosocial circumstances, and suicidal ideation exhibited the same declines in outpatient visit rates during April and May 2020 and a rebound, or increase in outpatient visit rates, in June 2020. The 3 conditions that did not follow this pattern still showed a decline in outpatient visit rates in April but demonstrated an earlier rebound in outpatient visit rates in May instead of June 2020.
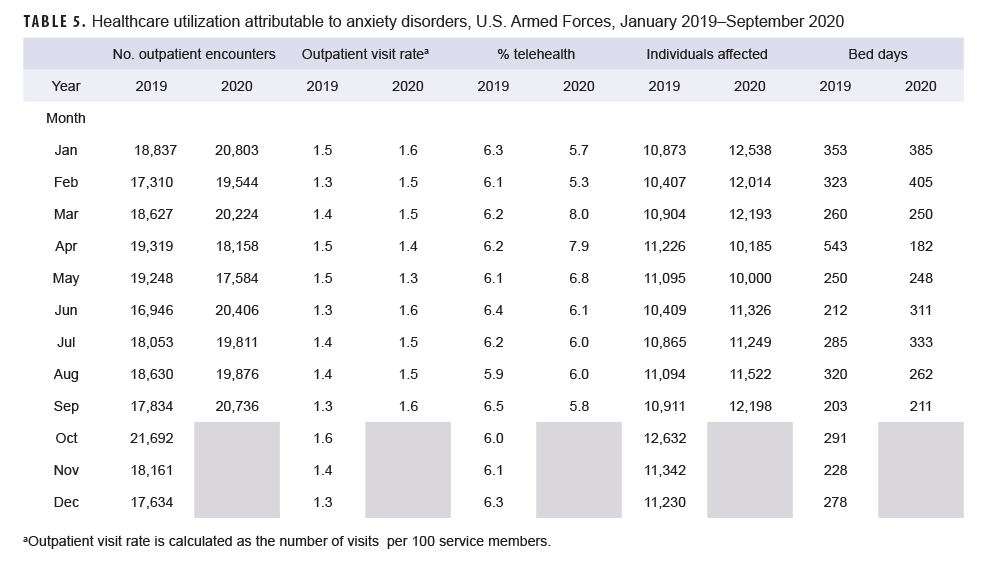
Similarly, while most specific MH/BH conditions demonstrated generally lower outpatient visit rates during June–September 2020 as compared to the previous year, 3 conditions (adjustment disorders, anxiety disorders, psychosocial circumstances) had, on average, higher outpatient visit rates than the same period in 2019. Average visit rates were slightly elevated for adjustment disorders (5% higher) and psychosocial circumstances (2% higher), while outpatient visit rates for anxiety disorders averaged 13% higher from June through September 2020 as compared to the same time period in 2019 (Tables 3, 5, 8).
Telehealth usage for 8 out of 10 specific MH/BH conditions also followed a pattern in which the percentage of outpatient care delivered via telehealth increased in March and April 2020 but declined in May 2020. Exceptions to this trend were seen for anxiety disorders and suicidal ideation (Tables 5, 10). In March 2020, the percentage of outpatient care delivered by telehealth related to anxiety disorders increased by 53%, but declined over the remainder of the surveillance period while telehealth use for suicidal ideation spiked in April 2020 and subsequently declined through September 2020.
Editorial Comment
In this analysis of MH/BH health care utilization prior to and during the first 6 months of the pandemic, telehealth usage increased during the early pandemic and was on average 25% higher during March–September 2020 as compared to the previous year. In contrast, MH/BH outpatient visit rates declined modestly between March and May 2020 before rebounding in June and remaining stable for the remainder of the surveillance period. The number of bed days attributable to MH/BH conditions also declined during March and April 2020 and was on average 30% lower during March–September 2020 as compared to the same period in the prior year. The pattern of decreased health care utilization and increased telehealth usage was almost universal across all conditions surveyed during March and April 2020, although for most MH/BH conditions, health care utilization had rebounded by June of that year.
Notably, even after health care utilization for mental and behavioral health conditions had begun to rebound in June 2020, outpatient visit rates for anxiety disorders, adjustment disorders, and psychosocial circumstances were higher than rates during the previous year.
There are few published studies of population-level health care utilization data with which to compare these findings. Patel et al. reported similar trends in outpatient care delivery and telehealth usage in a large, commercially insured population and, like this MSMR analysis, also demonstrated pronounced declines in the rate of in-person outpatient visits beginning in March 2020.14 Patel et al. also documented increases in telehealth usage during the same period with marked increases in the rate of telehealth usage beginning during the week of March 17 (coinciding with the expansion of Medicare reimbursement for telehealth during the COVID-19 pandemic).14
Data from the CDC’s National Syndromic Surveillance System Program (which represents approximately 70% of U.S. emergency department [ED] visits) were used in a cross-sectional study of ED visits for mental health before and during the pandemic.13 This study reported declines in overall ED visit volume after the implementation of stay-at-home orders in March which persisted through October 2020. However, visit rates for mental health, suicide attempts, drug overdoses, intimate partner violence and child abuse were higher in mid-March-October 2020 as compared to the same period during the prior year.13
The finding that telehealth usage for MH/BH conditions increased (albeit modestly) during the early period of the pandemic, as well as its usage prior to the pandemic, demonstrates that the Military Health System (MHS) was prepared to deliver mental health services via telehealth and to increase telehealth services when needed. In fact, a recent analysis of telehealth usage for all ambulatory encounters in 2020 reported telehealth accounted for 19.2% of ambulatory encounters in active component service members.16 This is likely a reflection of the Defense Health Agency's (DHA's) ongoing expansion and standardization of telehealth service capabilities.17 The TRICARE Health Plan already covered most mental health care when provided via telehealth prior to the pandemic. Regional contractors for TRICARE had also established a network of telemental health service providers.18 In response to COVID-19, TRICARE also began reimbursement for audio-only care, loosened cross-state licensure requirements, and began waiving copays and cost shares for telehealth services for the duration of the public health emergency.10 TRICARE also began allowing more providers to offer telemedicine services.18 In addition the MHS developed Health Protection Condition-linked guidance to standardize behavioral health operations during the COVID-19 response including support services for active component service members and their families.10
While many studies have reported increased levels of anxiety, depression, alcohol and substance misuse, and suicidal ideation in response to the pandemic, many of these studies relied on self-report data collected via survey.3–5 In contrast, this analysis used health care claims data to quantify health care utilization for specific MH/BH conditions which were identified via ICD-10 codes listed in the primary diagnostic position. To be included in this analysis, a service member would have to seek medical care and have that medical care documented in the electronic health record by a medical provider. Mental or behavioral health symptoms which did not result in a health care encounter would not be captured in this analysis and is a limitation of this analysis.
There are likely active component members who experienced symptoms of anxiety, depression or other mental and behavioral health issues who are not represented in this analysis because they chose not to seek care related to these symptoms. Service members may have been able to cope with their symptoms using resources other than medical care (e.g., chaplain, family, community, or command support). Service members may also have chosen to defer care due to the pandemic. An estimated 40.9% of adults in the U.S. have avoided medical care during the pandemic with 31.5% forgoing routine care.6
A significant strength of this study is the ability to include the entire population of interest in the analysis. The DMSS captures virtually 100% of health care encounters for active component service members and includes both Click to closeDirect CareDirect care refers to military hospitals and clinics, also known as “military treatment facilities” and “MTFs.”direct care (provided at military treatment facilities) and outsourced care (paid for by TRICARE).
MH/BH conditions can negatively affect service member readiness. Offering alternative methods to in-person care for these conditions, such as telehealth, facilitates access to care which can help mitigate adverse impacts to health, well being, and readiness. Continued surveillance is warranted to track MH/BH health care utilization during the later months of the pandemic to ensure that sufficient resources continue to be directed towards MH/BH care to support the health and readiness of active component service members.
Acknowledgements: The authors thank Maisha Toussaint, PhD (U.S. Army Public Health Center) for contributions including conceptual contributions during initial study design and critical review and feedback on the manuscript.
Disclaimer: The contents, views or opinions expressed in this publication or presentation are those of the author(s) and do not necessarily reflect official policy or position of the Defense Health Agency, the Department of Defense (DOD), or Departments of the Army, Navy, or Air Force. The mention of any non-federal entity and/or its products is not to be construed or interpreted, in any manner, as federal endorsement of that non-federal entity or its products.
References
- Moreland A, Herlihy C, Tynan MA, et al. Timing of state and territorial COVID-19 stay-at-home orders and changes in population movement – United States, March 1–May 31, 2020. MMWR Morb Mortal Wkly Rep. 2020; 69(35): 1198–1203.
- Xiong J, Lipsitz O, Nasri F, et al. Impact of COVID-19 pandemic on mental health in the general population: A systematic review. J Affect Disord. 2020 Dec 1;277:55–64.
- CDC, National Center for Health Statistics. Indicators of anxiety or depression based on reported frequency of symptoms during the last 7 days. Household Pulse Survey. Atlanta, GA: US Department of Health and Human Services, CDC, National Center for Health Statistics; 2020. https://www.cdc.gov/nchs/covid19/pulse/mental-health.htm
- CDC, National Center for Health Statistics. Early release of selected mental health estimates based on data from the January–June 2019 National Health Interview Survey. Atlanta, GA: US Department of Health and Human Services, CDC, National Center for Health Statistics; 2020. https://www.cdc.gov/nchs/data/nhis/earlyrelease/ERmentalhealth-508.pdf
- Czeisler MÉ, Lane RI, Petrosky E, et al. Mental health, substance use, and suicidal ideation during the COVID-19 pandemic - United States, June 24–30, 2020. MMWR Morb Mortal Wkly Rep. 2020 Aug 14;69(32):1049–1057.
- Czeisler MÉ, Marynak K, Clarke KEN, et al. Delay or avoidance of medical care because of COVID-19-related concerns - United States, June 2020. MMWR Morb Mortal Wkly Rep. 2020 Sep 11;69(36):1250–1257.
- Hoyer C, Ebert A, Szabo K, Platten M, Meyer-Lindenberg A, Kranaster L. Decreased utilization of mental health emergency service during the COVID-19 pandemic. Eur Arch Psychiatry Clin Neurosci. 2020 Jun 9:1–3.
- Verma S. Early Impact of CMS Expansion of medicare telehealth during COVID-19. Health Affairs Blog. Published July 15, 2020. Accessed May 10, 2021. https://www.healthaffairs.org/do/10.1377/hblog20200715.454789/full
- Connolly SL, Stolzmann KL, Heyworth L, Weaver KR, Bauer MS, Miller CJ. Rapid increase in telemental health within the Department of Veterans Affairs during the COVID-19 pandemic [published online ahead of print, 2020 Sep 14]. Telemed J E Health. 2020;10.
- Bradford C. Department of Defense (DoD) mental health response to the COVID-19 pandemic. Oral presentation at: AMSUS The Society of Federal Health Professionals Annual Meeting; December, 2020; Virtual.
- Armed Forces Health Surveillance Division. Absolute and relative morbidity burdens attributable to various illnesses and injuries, active component, U.S. Armed Forces, 2020. MSMR. 2021; 28(5): 2–9.
- Mandelkorn U, Genzer S, Choshen-Hillel S, et al. Escalation of sleep disturbances amid the COVID-19 pandemic: a cross-sectional international study. J Clin Sleep Med. 2021;17(1):45–53.
- Alexander N. What's more general than a whole population? Emerg Themes Epidemiol. 2015;12:11.
- Patel SY, Mehrotra A, Huskamp HA, Uscher-Pines L, Ganguli I, Barnett ML. Trends in outpatient care delivery and telemedicine during the COVID-19 pandemic in the US. JAMA Intern Med. 2021;181(3):388–391.
- Holland KM, Jones C, Vivolo-Kantor AM, et al. Trends in US Emergency Department visits for mental health, overdose, and violence outcomes before and during the COVID-19 pandemic. JAMA Psychiatry. 2021;78(4):372–379.
- Armed Forces Health Surveillance Division. Ambulatory visits, active component, U.S. Armed Forces, 2020. MSMR. 2021; 28(5): 18–25.
- Defense Health Board. Modernization of the TRICARE benefit. Published 2020. Accessed Aug. 13, 2021. https://health.mil/Reference-Center/Reports/2020/11/05/Modernization-of-the-TRICARE-Benefit
- Telemental Health Services. Accessed August 13, 2021. Updated 6/18/2020. https://tricare.mil/CoveredServices/IsItCovered/TelementalHealth