This Surveillance Snapshot provides an overview of the 2023-2024 mid-season analysis of influenza VE against medically-attended ambulatory influenza infections among active component service members. Data from the Defense Medical Surveillance System, the NHRC’s respiratory surveillance program, and standardized laboratory data provided by the Defense Centers for Public Health–Portsmouth were used for this analysis.1,2 A case test-negative study design was implemented among the population of ACSMs from all services who were tested for influenza between December 1, 2023 and February 23, 2024—the period of peak influenza activity for the season.
Cases were defined as individuals with a positive influenza result from a rapid antigen, reverse transcription polymerase chain reaction or culture influenza assay. Test-negative controls were individuals with a negative influenza result from a RT-PCR or culture influenza assay. Crude odds ratios were calculated and multivariate logistic regression was used to calculate adjusted ORs (adjusted for sex, age category, prior vaccination [any influenza vaccine in previous 5 years], and month of diagnosis) and 95% confidence intervals. VE estimates were defined as (1 - OR) x 100.
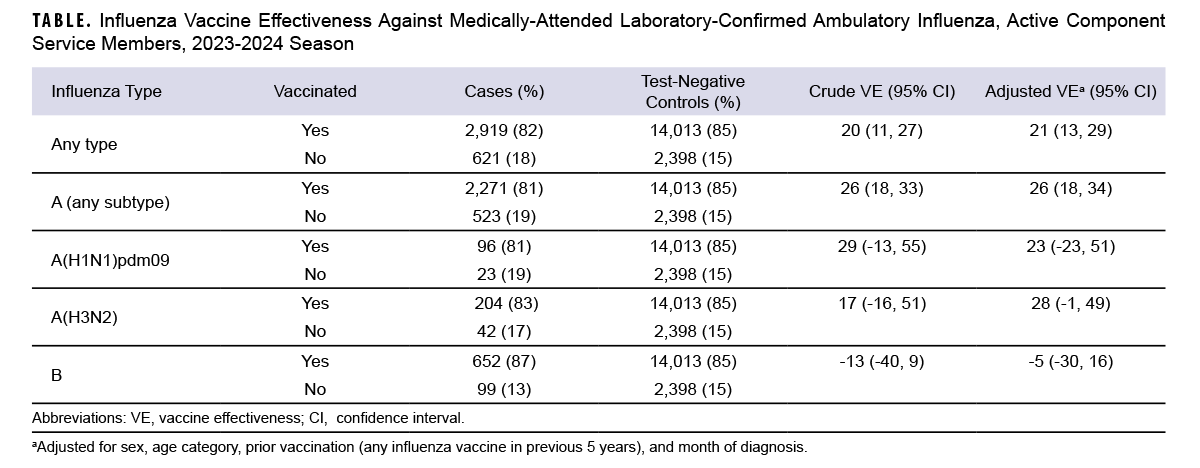
There were 3,540 cases—2,794 A (any subtype), 246 A(H3N2), 119 A(H1N1)pdm09, 751 B (any type)—and 16,411 TNCs. TNCs were more likely vaccinated (85.4%) than cases (82.5%). VE varied by influenza type (Table). Statistically significant VE was found against any influenza case with an adjusted VE of 21% (95% CI: 13, 29) and influenza A (any subtype) with an adjusted VE of 26% (95% CI: 18, 34). The VE point estimate against influenza A(H1N1)pdm09 and A(H3N2) showed effectiveness, but did not reach statistical significance (23% [95% CI: -23, 51] and 28% [95% CI: -1, 49], respectively). This mid-season assessment did not find the vaccine to be effective against influenza B ambulatory infections (-5% [95% CI: -30, 15]).
The results of this analysis show low protection of the 2023-2024 seasonal influenza vaccines against medically-attended influenza A infections that resulted in ambulatory care visits among ACSMs. As these estimates were obtained during the middle of the influenza season, VE estimates and CIs may change when data from the full season are available and sample sizes increase.
References
- Rubertone MV, Brundage JF. The Defense Medical Surveillance System and the Department of Defense serum repository: glimpses of the future of public health surveillance. Am J Public Health. 2002;92(12):1900-1904. doi:10.2105/ajph.92.12.1900
- https://www.med.navy.mil/Naval-Medical-Research-Command/R-D-Commands/Naval-Health-Research-Center/Core-Research/Operational-Infectious Diseases/respiratory-surveillance-2023-2024