Influenza vaccines have been used by the U.S. military since the 1940s, and were required annually from the 1950s until 2026 for active component service members (ACSMs),1 but annual estimates of military influenza program vaccine effectiveness (VE), through traditional observational test-negative case control studies, typically demonstrate lower VE among ACSMs when compared to national data. Multiple factors may influence this disparity, including diminished antibody response to multiple vaccinations, waning immunity during the influenza season, and study design limitations including adequate statistical power.2 This Surveillance Snapshot summarizes seasonal influenza VE among ACSMs from 2016 through 2025 compared to U.S. Centers for Disease Control national estimates and describes statistical power challenges in calculating VE in the highly vaccinated U.S. military population.
The Armed Forces Health Surveillance Division (AFHSD) utilizes Defense Medical Surveillance System data to generate seasonal influenza VE estimates for ACSMs. Each season, a test-negative observational case-control design, previously reported,3 is used to calculate influenza VE in the U.S. military. The frequent use of this design is due to key methodological advantages: It simplifies execution by identifying cases and controls concurrently and draws sample cases from a population with similar health care-seeking behaviors (i.e., minimizes confounding). Historically, these strengths have made the test-negative design the preferred method for calculating the seasonal VE for influenza, both within the military and nationally.2 Each year, however, this VE analysis is subject to variance in influenza severity (i.e., case volume) and testing frequency (i.e., number of controls).
‘Power’ is the probability a statistical test will correctly reject a false null hypothesis (e.g., vaccine has no effect). In general, power increases with a larger sample size and more controls matched to cases. A ratio of 1-to-4 (case[s]-to-controls) is generally considered the threshold ratio, when adding more controls provides little additional power, but higher ratios may be beneficial in large studies with small significance levels.4 Sample sizes necessary for adequate power to detect significant VE in highly vaccinated populations can be estimated: For example, the World Health Organization sample size calculator indicates that a VE evaluation employing a case-control test-negative study design with a 1:4 case-to-control ratio, predicted VE of 40%, confidence interval length of 10%, expected vaccine coverage of 90%, and power of 80% requires a sample size of over 5,700 cases and 22,900 controls.5
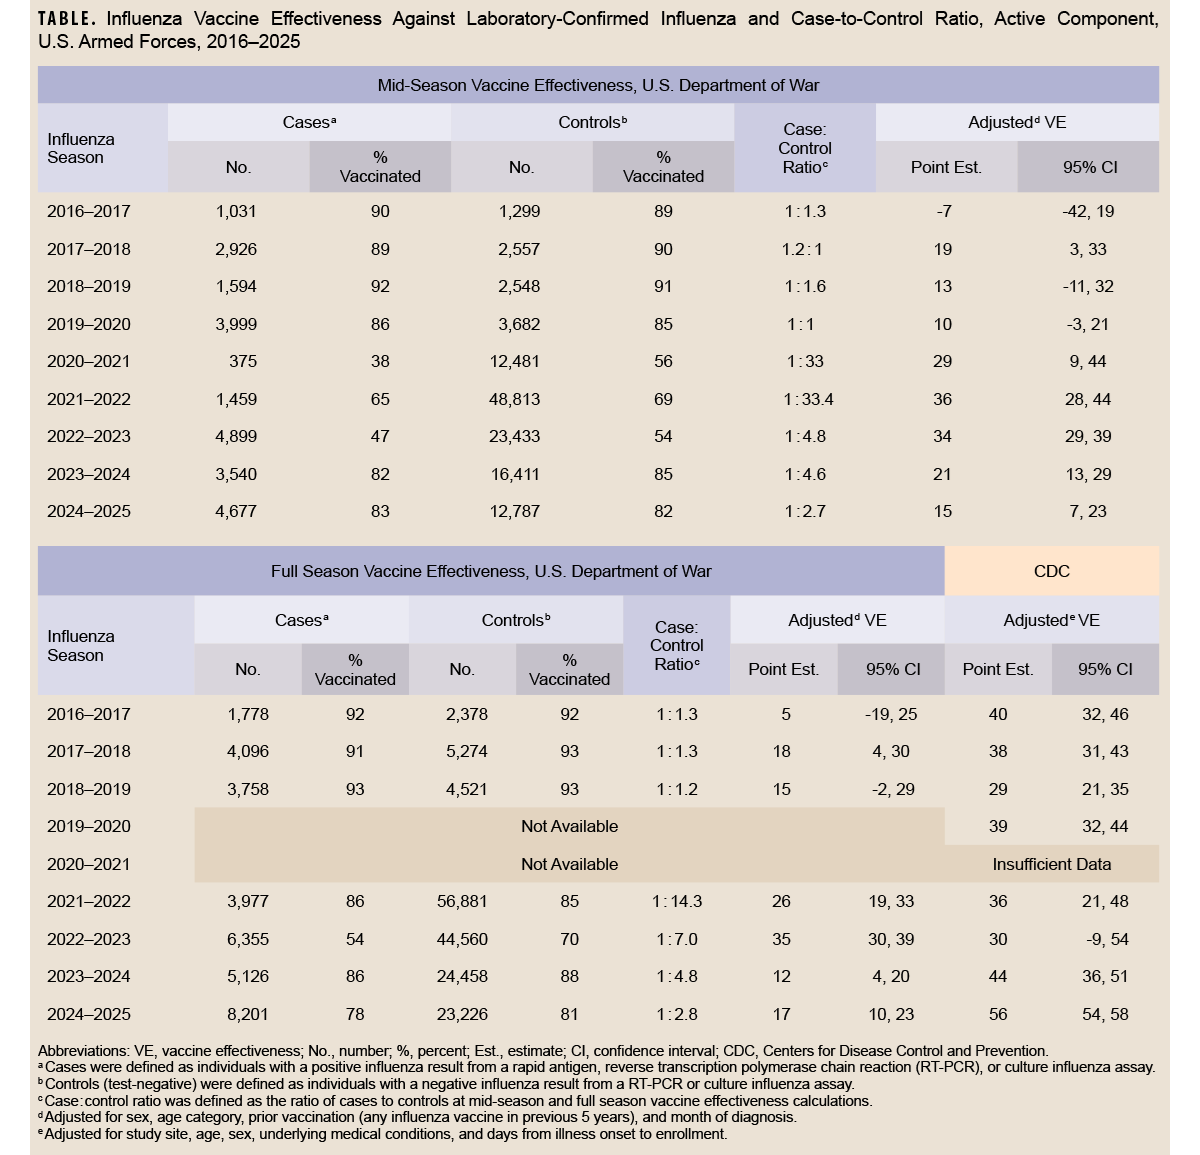
Table 1 summarizes AFHSD annual (when available) and mid-season influenza adjusted VE estimates from 2016 through 2025 for ACSMs with numbers of cases and controls, percentages vaccinated, and ratios of cases to controls.6-13 Seasonal comparisons demonstrate that years with increased sample sizes, higher case-to-control ratios, and lower vaccination coverage produced VE estimates consistent with the general population (2021-2022, 2022-2023 seasons),14 indicating that this case-control test-negative study design is often under-powered, due to the typically high vaccination coverage of the ACSM population as a result of the historical annual goal of greater than 90% immunization. When interpreting annual VE estimates in a highly immunized population, considering the statistical power and sample size required is important for contextualizing the results and detecting significant VE.
References
- Grabenstein JD, Pittman PR, Greenwood JT, Engler RJM. Immunization to protect the US Armed Forces: heritage, current practice, and prospects. Epidemiol Rev. 2006;28(1):3-26. doi:10.1093/epirev/mxj003
- Sayers DR, Iskander JK. Influenza vaccine effectiveness and test-negative study design within the Department of Defense. Mil Med. 2023;188(11-12):289-291. doi:10.1093/milmed/usac436
- Eick-Cost AA, Hu Z. Mid-season influenza vaccine effectiveness against laboratory-confirmed ambulatory influenza among U.S. active component service members, December 1, 2024–February 8, 2025. MSMR. 2025;32(3):20. Accessed May 18, 2026. https://www.health.mil/news/articles/2025/03/01/msmr-flu-vaccine-effectiveness
- Iwagami M, Shinozaki T. Introduction to matching in case-control and cohort studies. Ann Clin Epidemiol. 2022;4(2):33-40. doi:10.37737/ace.22005
- World Health Organization. Sample Size Calculator for Evaluation of COVID-19 Vaccine Effectiveness (Excel). Mar. 17, 2021. Accessed Feb. 3, 2026. https://www.who.int/publications/i/item/WHO-2019-nCoV-vaccine_effectiveness-measurement_tool-2021.1
- Toure E, Eick-Cost AA, Hawksworth, W, et al. Mid-season influenza vaccine effectiveness estimates for the 2016-2017 influenza season. MSMR. 2017;24(8):17-19. Accessed Feb. 3, 2026. https://www.health.mil/reference-center/reports/2017/01/01/medical-surveillance-monthly-report-volume-24-number-8
- Coleman R, Mancuso JD. Department of Defense end-of-season influenza vaccine effectiveness estimates for the 2017-2018 season. MSMR. 2018;25(10):16-20. Accessed Feb. 3, 2026. https://www.health.mil/reference-center/reports/2018/01/01/medical-surveillance-monthly-report-volume-25-number-10
- Lynch LC, Coleman R, DeMarcus L, et al. Department of Defense midseason estimates of vaccine effectiveness for the 2018-2019 influenza season. MSMR. 2019;26(7):24-27. Accessed Feb. 3, 2026. https://www.health.mil/reference-center/reports/2019/07/01/medical-surveillance-monthly-report-volume-26-number-7
- Thervil JW, Williams VF, Coleman R, et al. Department of Defense mid-season vaccine effectiveness estimates for the 2019-2020 influenza season. MSMR. 2021;28(6):16-19. Accessed Feb. 3, 2026. https://www.health.mil/reference-center/reports/2021/06/01/medical-surveillance-monthly-report-volume-28-number-06
- U.S. Food and Drug Administration. Vaccines and Related Biological Products Advisory Committee March 3, 2022 Meeting Announcement. U.S. Dept. of Health and Human Services. Mar. 3, 2022. Accessed Feb. 3, 2026. https://www.fda.gov/advisory-committees/advisory-committee-calendar/vaccines-and-related-biological-products-advisory-committeemarch-3-2022-meeting-announcement
- U.S. Food and Drug Administration. Vaccines and Related Biological Products Advisory Committee Mar. 7, 2023 Meeting Announcement. U.S. Dept. of Health and Human Services. Feb. 23, 2023. Accessed Feb. 3, 2026. https://www.fda.gov/advisory-committees/advisory-committee-calendar/vaccines-and-related-biological-products-advisory-committee-march-7-2023-meeting-announcement
- Eick-Cost AA, Hu Z. 2023-2024 mid-season influenza vaccine effectiveness against laboratory-confirmed ambulatory influenza: U.S. active component service members. MSMR. 2024;31(3):22. Accessed Feb. 3, 2026. https://www.health.mil/reference-center/reports/2024/03/01/msmr-march-2024-volume-31-number-3
- Eick-Cost AA, Hu Z. Mid-season influenza vaccine effectiveness against laboratory-confirmed ambulatory influenza among U.S. active component service members, December 1, 2024–February 8, 2025. MSMR. 2025;32(3):20. Accessed Feb. 3, 2026. https://www.health.mil/news/articles/2025/03/01/msmr-flu-vaccine-effectiveness
- Centers for Disease Control and Prevention. How Flu Vaccine Effectiveness and Efficacy Are Measured. U.S. Dept. of Health and Human Services. May 30, 2025. Accessed Feb. 3, 2026. https://www.cdc.gov/flu-vaccines-work/php/effectiveness-studies/index.html
Author Affiliations
Department of Preventive Medicine and Biostatistics, Uniformed Services University of the Health Sciences, Bethesda, MD: Lt Col Sayers; Epidemiology and Analysis Branch, Armed Forces Health Surveillance Division, Public Health Directorate, Defense Health Agency, Silver Spring, MD: Dr. Eick-Cost
Disclaimers
The opinions and assertions expressed herein are those of the authors and do not reflect official policy nor position of the Uniformed Services University of the Health Sciences or the U.S. Department of War. This work was prepared by military and contract employees of the U.S. Government as part of official duties and therefore is in the public domain and does not possess copyright protection. Public domain information may be freely distributed and copied; as a courtesy, it is requested that the Uniformed Services University and authors are appropriately acknowledged.
The authors have no conflicts of interest to declare.