Abstract
During calendar year 2019, the estimated prevalence of myopia, hyperopia, and astigmatism were 17.5%, 2.1%, and 11.2% in the active component of the U.S. Armed Forces and 10.1%, 1.2%, and 6.1% of the U.S. Coast Guard, respectively. The prevalence of spectacle correction in the active component of the U.S. Armed Forces was 24.0%, which included single-vision distance (92.0%), multifocal (eg, bifocal, 6.0%), and single-vision reading (2.0%) spectacles. In comparison, the prevalence of spectacle correction was 14.6% in the U.S. Coast Guard. Additionally, among all U.S. Armed Forces service members who received spectacle correction for distance vision in 2019, service members of the reserve component, military academy cadets, and the National Guard were significantly more myopic (near-sightedness) than the active component or Coast Guard (p<.001). Within the active component, the Air Force was the most myopic and the Marine Corps followed it closely. These 2 military branches were not significantly different from each other (p=.46) but both were significantly more myopic than the Navy or the Army (p<.001). The Navy was more myopic than the Army (p=.01). The U.S. Coast Guard was significantly less myopic than any other military branch (p=.03).
What are the new findings?
Warfighters with a functional unaided vision have significant advantage on the battlefield or in other operational environments. During calendar year 2019, the prevalence of refractive errors in the active component of the U.S. Armed Forces and U.S. Coast Guard were relatively low. Approximately 20% of the active component service members had substantial refractive errors that require fulltime spectacle correction.
What is the impact on readiness and force health protection?
Refractive distribution of the U.S. Armed Forces is essential for better understanding of warfighter visual capabilities, establishing vision standards and policies, and supporting acquisition and development of the next generation military
protective eyewear and devices.
Background
Uncorrected refractive error is the leading cause of visual impairment worldwide.1 Refractive error occurs when there is a mismatch between axial length of the eye and the refractive power produced by the cornea and the crystalline lens. The eye is myopic (near-sighted) when the eye’s axial length is longer and images of distant objects focus in front of the retina.2 Hyperopia (far-sightedness) occurs when the axial length is shorter and images of distant objects focus behind the retina.2 With a low amount of hyperopia, a younger eye (i.e., approximately under age 40) can achieve clear images through accommodation in which the ciliary muscles contract and cause the crystalline lens to increase its refractive power. Astigmatism reduces quality of vision by differential magnification in each principal meridian of the cornea and/or the crystalline lens.3 It is another form of ocular aberration that induces blurred vision.3 Presbyopia is an age-related, blurred near vision due to progressive loss of accommodation (i.e., near focusing ability) that usually begins to manifest after the age of 40.4
The prevalence of myopia, the most common type of refractive error, increased worldwide from 10.4% to 34.2% between 1993 through 20165 and in the United States from 25.0% to 41.6% between 1970 through 2000.6 Among military service members, one study describes a similar trend for Austrian military conscripts; Yang et al. reported that the prevalence of myopia increased from 13.8% to 24.4% between 1983 through 2017.7
In the active component of the U.S. Armed Forces, Reynolds et al. estimated a crude lifetime prevalence of myopia was 38.5%, based on medical diagnostic codes for refractive error in the U.S. Defense Medical Surveillance System from 2001 through 2018.8 The study also reported a crude lifetime prevalence of 12.0% for hyperopia and 32.9% for astigmatism.8 Moreover, an earlier study showed that 22% of the active component U.S. Army aviators and 27%–32% of the U.S. Army Reserve and National Guard members wore spectacle vision correction between 1986 through 1989.9
The distribution of refractive errors and the proportions of the U.S. Armed Forces and the U.S. Coast Guard that require spectacle vision correction are yet to be determined. The purpose of this study was to examine the prevalence and distribution of refractive errors and to evaluate spectacle corrections among active component U.S. Armed Forces and U.S. Coast Guard service members in 2019. Furthermore, the differences in mean refractive corrections are examined among all U.S. Armed Forces service members who received spectacle corrections for distance vision in 2019, to include the active component, reserve component, National Guard, and military academy cadets.
Methods
This retrospective study evaluated spectacle prescriptions in the Spectacle Request Transmission System (SRTS) of the U.S. Department of Defense (DOD) during calendar year 2019. Study populations included the active component of the U.S. Armed Forces (Air Force, Army, Navy and Marine Corps) and the U.S. Coast Guard. The U.S. reserve component, National Guard, and military academy cadet populations were used for comparison. Denominator data to calculate prevalence estimates were obtained from the U.S. Defense Manpower Data Center (DMDC).
SRTS Database
The SRTS determines a member’s military service status (e.g., Navy, active duty) automatically during spectacle ordering as result of its interface with the DMDC. There were 1,701,907 spectacle orders among 390,217 active duty service members in 2019. Specifically, active duty service members who ordered spectacle correction for distance and/or near vision (n=323,753) included the active component of the U.S. Armed Forces (97.9%), the U.S. Coast Guard (1.8%), and others (i.e., non-U.S. military, 0.3%).
Each member may have one or more spectacle orders using the same spectacle prescription (e.g., clear and sunglasses, optical inserts for gas mask and military eye protection, etc.). Occasionally, different spectacle prescriptions may be used when distance and computer/reading spectacles were ordered separately (e.g., bifocal glasses for computer/reading or single vision glasses for near vision). Therefore, a spectacle prescription with the lowest spherical power of the right eye was selected to ensure only one spectacle prescription for distance vision per service member was chosen, and spectacle prescriptions exclusively for near vision were excluded from refractive distribution analysis.
As a result, the SRTS database for refractive distribution analysis identified 379,254 spectacle prescriptions for distance vision in 2019, which included prescriptions for service members of the active component (83.3%), National Guard (4.9%), reserve component (3.4%), retired military members (7.2%), military academy cadets (0.8%), and others (e.g., non-U.S. military) (0.3%). Analyses describing the proportions of refractive errors were restricted to active component service members, including 310,765 service members from the U.S. Armed Forces and 5,768 service members from the U.S. Coast Guard. Differences in the magnitudes of mean refractive corrections are examined for all U.S. Armed Forces, to include service members of the reserve component (n=12,984), military academy cadets (n=3,222), National Guard (n=18,773), Air Force (n=81,163), Marine Corps (n=37,253), Navy (n=56,985), Army (n=135,364) and Coast Guard (n=5,768).
Definition
Spectacle correction was defined as having a spectacle prescription in the SRTS. Spectacle refractive power is expressed in diopter (D) in spherical equivalent (SE), which was defined as spherical refraction plus one-half of the negative cylindrical value. A negative SE indicates refraction for myopia and a positive SE indicates refraction for hyperopia. Astigmatism is shown as a negative cylinder (CYL) power. Astigmatism type was defined as With-the-Rule (minus cylinder axis 180° ± 15°), Against-the-Rule (minus cylinder axis 90° ± 15°), and Oblique (all other orientations).
Refractive error classification
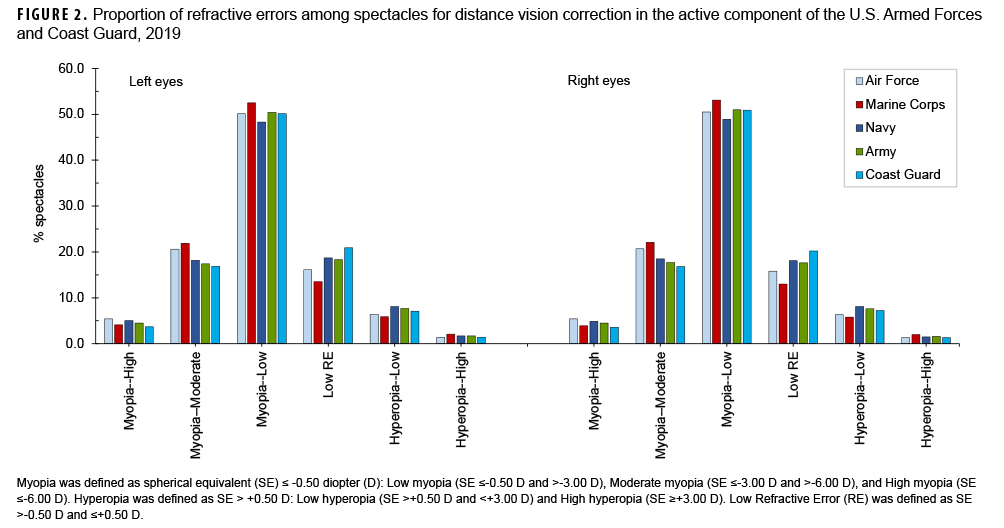
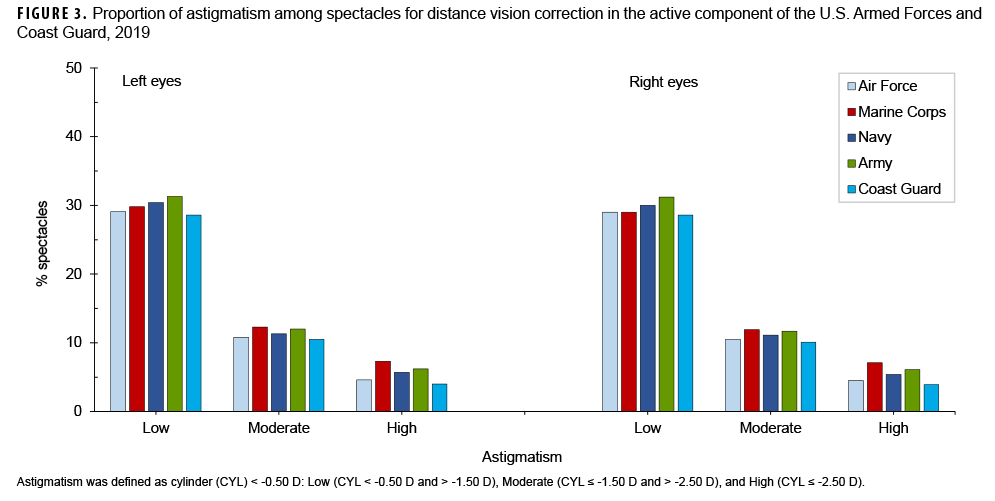
SE was utilized to classify the low/moderate/high classifications for myopia and hyperopia. Based on the current scientific consensus of refractive errors classification,2,5,10-13 myopia was classified as SE=-0.50 D and was further divided into Low (SE=-0.50 D and >-3.00 D), Moderate (SE=-3.00 D and >-6.00 D), and High (SE=-6.00 D) myopia. Hyperopia was defined as SE>+0.50 D that was further divided into Low (SE>+0.50 D and <+3.00 D) and High (SE=+3.00 D) hyperopia. Low Refractive Error was defined as SE>-0.50 D and =+0.50 D. Astigmatism was defined as CYL<-0.50 D that was further divided into Low (CYL<-0.50 D and >-1.50 D), Moderate (CYL=-1.50 D and >-2.50 D), and High (CYL=-2.50 D) astigmatism.
Statistical analysis
IBM SPSS Statistics for Windows, Version 21.0 (Armonk, NY: IBM Corp) was used for statistical analyses. To estimate the prevalence of spectacle correction, counts of active-duty service members who had spectacle correction for distance and/or near vision served as numerators and DMDC population counts served as denominators. Likewise, counts of active duty members, which were grouped by refractive error classification from their spectacle prescriptions for distance vision, served as numerators and DMDC population counts served as a denominators for prevalence of refractive error calculations.
For refractive distribution analysis, a two-tailed paired t-test was used to compare refractive errors between the right and left eyes and z-tests were used to compare the active component of the U.S. Armed Forces and the U.S. Coast Guard populations. Analysis of variance was used to analyze overall effects on refractive correction among military branches and groups. A Bonferroni post hoc test was used to adjust for multiple comparisons. Results were expressed as mean ± standard error. The statistical significance level was set at p<.05.
Results
Prevalence of spectacle correction
Assuming all members who required vision correction had ordered spectacles in 2019, the prevalence of spectacle correction was 24.0% in the active component of U.S. Armed Forces and 14.6% in the U.S. Coast Guard. The difference between the two populations was statistically significant (p<.001). Single-vision distance glasses were the most common type (92.0%) and followed by multifocal (e.g., bifocal, 6.0%) and single-vison reading (2.0%) glasses in the active component of the U.S. Armed Forces.
Prevalence of refractive errors
The prevalence of myopia (SE=-0.50 D) was 17.5%, hyperopia (SE>+0.50 D) was 2.1%, and astigmatism (CYL<-0.50 D) was 11.2% in the active component of the U.S. Armed Forces (n=310,765). In comparison, the prevalence of myopia was 10.1%, hyperopia was 1.2%, and astigmatism was 6.1% in the U.S. Coast Guard (n=5,768). There was a statistically significant difference between the two populations (p<.001). The prevalence of high myopia (SE=-6.00 D) and high hyperopia (SE=+3.00 D) were 1.1% and 0.7% in the active component of the U.S. Armed Forces, and 0.5% and 0.4% in the U.S. Coast Guard, respectively.
Refractive distribution
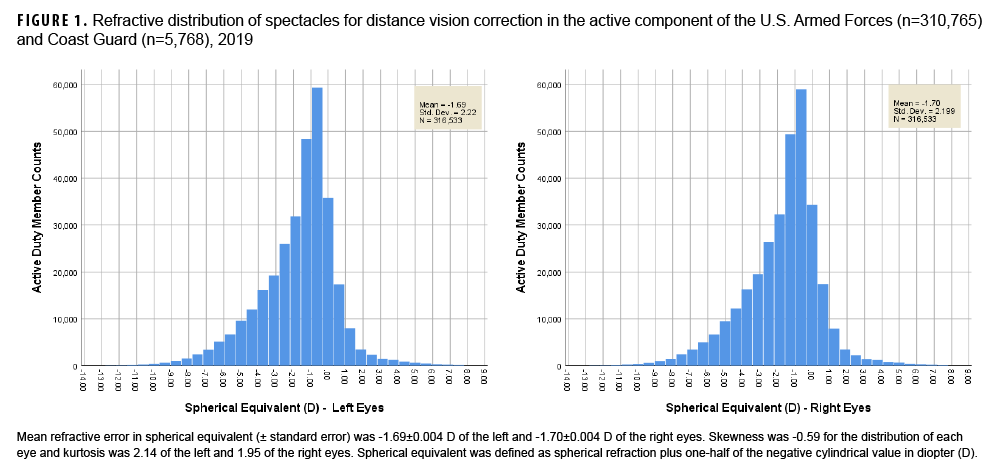
The overall refractive distribution of the two active duty populations is shown in Figure 1. The right and left eyes had a small but statistically significant difference in sphere (mean difference: -0.020±0.001 D), cylinder (mean difference: 0.013±0.001 D), and spherical equivalent (mean difference: -0.013±0.001 D) refraction (p<.001). Both eyes were significantly correlated (r=0.954, 0.780, and 0.959, respectively, [p<.001]).
The proportion of refractive errors in spherical equivalent (Figure 2) was not significantly different between the active component of the U.S. Armed Forces and the U.S. Coast Guard (p=.79). In the active component of the U.S. Armed Forces, the largest proportion of myopia was classified as Low (50.8%), followed by Moderate (19.2%), and just 4.7% were classified as High. Similarly, a larger proportion of hyperopia was classified as Low (7.1%) versus High (1.6%). The proportion of Low Refractive Error was 16.7%. Astigmatic spectacle correction (Figure 3) was 30.2% (Low), 11.3% (Moderate), and 5.8% (High). With-the-Rule astigmatism (minus cylinder axis 180°±15°) was 55.5%. Against-the-Rule astigmatism (minus cylinder axis 90°±15°) was 18.2%. Oblique astigmatism (all other orientations) was 26.3%.
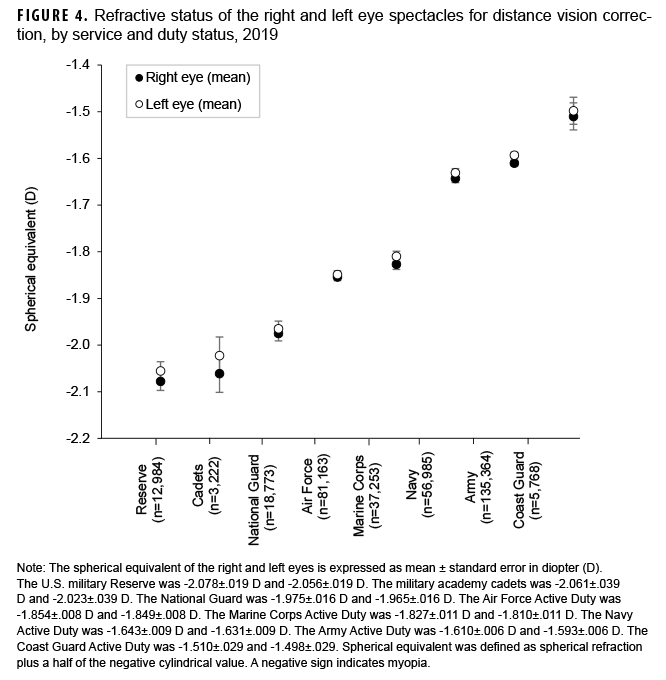
Analysis of differences in the magnitude of mean refractive corrections among the active component of the U.S. Armed Forces and the U.S. Coast Guard, National Guard, Reserve, and military academy cadets revealed a statistically significant difference in refractive correction among these groups (p<.001) (Figure 4). Pairwise comparison with Bonferroni adjustment showed that refractive correction for the active component of the U.S. Armed Forces or the U.S. Coast Guard was significantly less myopic (near-sightedness) than that of the National Guard, the military academy cadets, and the Reserve (p<.001). In the active component of the U.S. Armed Forces, mean refractive corrections of the Air Force and of the Marine Corps were significantly more myopic than those of the Navy (p<.001) and the Army (p<.001). The Navy was more myopic than the Army (p=.01). Each military branch was more myopic than the Coast Guard (p=.03).
Editorial Comment
Prevalence of spectacle correction
Functional unaided vision is crucial in emergency, volatile, and high stress military operational environments. In agreement with an earlier study in which 22% of U.S. Army aviators wore spectacle correction,9 the estimated prevalence of spectacle correction from the current analysis was 24.0% in the active component of the U.S. Armed Forces and 14.6% in the U.S. Coast Guard.
The U.S. military medical requirements, the Periodic Health Assessment for individual medical readiness, and the Pre-Deployment Health Assessment require an annual vision screening and spectacle orders (e.g., prescription glasses and lens inserts for military combat eye protection/safety glasses).14-20 This study indicates that spectacles for vision correction were not ordered for over 3/4 of the active component of the U.S. Armed Forces. Furthermore, about 1/5 of those who ordered spectacles may not need fulltime vision correction because members with low refractive error or younger people with low hyperopia generally have “functional” unaided distance vision.
Prevalence of refractive errors
The prevalence of refractive errors in the U.S. Armed Forces and the U.S. Coast Guard was low relative to the general U.S. population. This study shows that the prevalence of myopia (SE=-0.50 D), hyperopia (SE>+0.50 D), and astigmatism (CYL<-0.50 D) was 17.5%, 2.1%, and 11.2%, respectively in the active component of the U.S. Armed Forces. In comparison, a recent systematic review and meta-analysis study showed that an estimated pooled prevalence of myopia (SE=-0.50 D), hyperopia (SE>+0.50 D), and astigmatism (CYL<-0.50 D) was 11.7%, 4.6%, and 14.9% among those under age 20, and 26.5%, 30.9%, and 40.4% in those over age 30.5 The 2004 Eye Diseases Prevalence Research Group estimated myopia prevalence at 26.6%, 25.4%, and 16.4 % for European, North American, and Australian populations.21
Moreover, visual impairment increases with increased magnitude of refractive errors. For instance, high myopia is much more likely to result in sight threatening visual impairments (e.g., myopic macular degeneration, retinal detachment, cataract, or open angle glaucoma) and hyperopic eyes had a 13% higher risk of early age-related macular degeneration.22-26 Results of this study show that the prevalence of pathologic high refractive errors, i.e., high myopia (SE=-6.00 D) or high hyperopia (SE=+3.00 D), was low in the active component of the U.S. Armed Forces and U.S. Coast Guard. In comparison, the prevalence of high myopia was 2.4–4.2% in the general population, and the prevalence of high hyperopia was 1–3% of younger and 10–13% of the older European population.12,27
The prevalence of refractive errors in this study was low in comparison to a crude annual prevalence of 38.5% for myopia, 12.0% for hyperopia, and 32.9% for astigmatism reported by Reynolds and colleagues.8 Different methodologies likely contribute to the major differences between the results of the two studies. The earlier study used outpatient medical encounter data and the refractive error definitions were based on International Classification of Disease (ICD) codes.8 In comparison, the current study used spectacle prescription data and relied on a more rigorous scientific consensus of refractive error classification. Another key factor is that individuals with a refractive error ICD code associated with an outpatient medical encounter may not necessarily require spectacle correction.
The U.S. Armed Forces had a lower prevalence of hyperopia because this study used spectacle prescriptions (i.e., not cycloplegic refraction), and a majority of the military population (90.5%) in the current study were under 40 years of age. A rising prevalence of hyperopia occurs in elderly populations due to age-related lens changes.5
Military medical policy on refractive error distribution
Vision screening prior to entering the military services contributes to the low prevalence and magnitude of refractive errors in the U.S. Armed Forces. Specifically, refractive errors in excess of -8.00 D or +8.00 D spherical equivalent or astigmatism in excess of 3.00 D are “disqualifying conditions” for entering the U.S. military.19 Additionally, the U.S. military refractive surgery program may further reduce the prevalence and magnitude of refractive errors by providing approximately 36,000 refractive surgeries (i.e., 18,000 service members) annually.28,29 The U.S. military refractive surgery program aims to enhance military members’ visual capability by reducing or eliminating dependency on spectacles and contact lenses.29,30 The program impacts on refractive distribution in the U.S. Armed Forces require further investigation; however, the low prevalence of refractive errors in the active component U.S. Armed Forces and Coast Guard was likely a result of better access to the medical procedure. Certainly, refractive surgery does not remove risks associated with pathologic high refractive errors or eliminate vision correction for life. Some individuals after refractive surgery may still need mild spectacle correction due to refractive progression over time.
Military implications and path forward
Warfighters with functional unaided vision have significant advantage on the battlefield or in other operational environments. In the U.S. Armed Forces and the U.S. Coast Guard, the study showed that around 20% of the active duty members required fulltime spectacle correction for distance vision. The study results are useful in understanding of warfighter unaided visual capabilities, determining the cost to the Military Health System, and budgeting for DOD and Defense Health Agency programs, such as the military refractive surgery, military combat eye protection (MCEP), the optical fabrication enterprise, and more.
Furthermore, the refractive distribution of the U.S. Armed Forces are valuable for planning and procuring the next generation MCEP or future military devices. For instance, the U.S. Army Program Executive Office Soldier may use the information for its consideration of MCEP with embedded prescription, which can negate the need for an additional layer of an optical insert and thus improve warfighters’ compliance, safety, and performance.31 Moreover, the study shows that the difference of refractive error between the right and left eyes was nearly 1/100th of a diopter, which is too small to be “clinically significant”. Therefore, engineers may consider using the same optical parameters for each eye when designing or developing future visual augmentation or enhancement devices (e.g., the integrated visual augmentation system). Astigmatic (cylindrical) correction is another important parameter for MCEP or other military devices. The prevalence of astigmatism (CYL<-0.50 D) was 11.2% of the active component of the U.S. Armed Forces and With-the-Rule astigmatism (minus cylinder axis 180°±15°) was the most common type. Cylindrical correction, especially for moderate and high astigmatism (CYL=-1.50 D) that was approximately 4.1% of the active component of U.S. Armed Forces, can greatly improve warfighter visual capability.
Lastly, presbyopia is less of a concern as over 90% of the active component service members were under 40 years of age. The prevalence of multifocal and reading glasses was less than 2% of the U.S. active component service members. In general, refractive distribution of the U.S. Armed Forces is essential for better understanding of warfighter visual capabilities, establishing vision standards and policies, and supporting acquisition and development of the next generation military protective eyewear and devices.
Strengths and limitations
The major strengths of this study are large sample size and the scientific refractive error classification, which provide a precise description of refractive distribution in the active component of the U.S. Armed Forces and the U.S. Coast Guard members. One limitation of the study is that prevalence of refractive errors calculation was under an assumption that all active duty members who needed spectacle correction had ordered one in 2019. Because some service members may have ordered their spectacle outside the observation period, the estimates of prevalence for all of the refractive errors may be underestimates.
Author Affiliations
Clinical Public Health and Epidemiology, U.S. Army Public Health Center, Aberdeen Proving Ground, MD (CDR Gao, LTC Truong, Dr. Taylor, Lt Col Robles-Morales, and LTC Aitken).
Acknowledgments
The authors would like to thank Ms. Barbara Fieldhausen and the Spectacle Request Transmission System (SRTS) team from the Defense Health Agency for their work managing the SRTSWeb and its database.
References
- Pascolini D, Mariotti SP. Global estimates of visual impairment 2010. Br J Ophthalmol. 2012;96(5):614–618.
- Committee on Vision - National Research Council. Myopia: prevalence and progression. Washington D.C.: National Academy of Sciences; 1989.
- Namba H, Sugano A, Nishi K, et al. Age-related variations in corneal geometry and their association with astigmatism: The Yamagata Study (Funagata). Medicine (Baltimore). 2018;97(43):e12894.
- Sharma G, Chiva-Razavi S, Viriato D, et al. Patient-reported outcome measures in presbyopia: a literature review. BMJ Open Ophthalmol. 2020;5(1):e000453.
- Hashemi H, Fotouhi A, Yekta A, Pakzad R, Ostadimoghaddam H, Khabazkhoob M. Global and regional estimates of prevalence of refractive errors: systematic review and meta-analysis. J Curr Ophthalmol. 2018;30(1):3–22.
- Vitale S, Sperduto RD, Ferris FL. Increased prevalence of myopia in the United States between 1971-1972 and 1999-2004. Arch Ophthalmol. 2009;127(12):1632–1639.
- Yang L, Vass C, Smith L, Juan A, Waldhor T. Thirty-five-year trend in the prevalence of refractive error in Austrian conscripts based on 1.5 million participants. Br J Ophthalmol. 2020;104(10):1338–1344.
- Reynolds ME, Taubman SB, Stahlman S. Incidence and prevalence of selected refractive errors, active component, U.S. Armed Forces, 2001-2018. MSMR. 2019;26(9):26–30.
- Schrimsher RH, Lattimore MR. Prevalence of spectacle wear among U.S. Army aviators. Optom Vis Sci. 1991;68(7):542–545.
- Flitcroft DI, He M, Jonas JB, et al. IMI - Defining and classifying myopia: a proposed set of standards for clinical and epidemiologic studies. Invest Ophthalmology & Vision Science. 2019;60(3):M20–M30.
- Holden BA, Fricke TR, Wilson DA, et al. Global prevalence of myopia and high myopia and temporal trends from 2000 through 2050. Ophthalmology. 2016;123(5):1036–1042.
- Williams KM, Verhoeven VJ, Cumberland P, et al. Prevalence of refractive error in Europe: the European Eye Epidemiology (E(3)) Consortium. Eur J Epidemiol. 2015;30(4):305–315.
- Yahya AN, Sharanjeet-Kaur S, Akhir SM. Distribution of refractive errors among healthy infants and young children between the age of 6 to 36 months in Kuala Lumpur, Malaysia-a pilot study. Int J Environ Res Public Health. 2019;16(23):4730.
- Department of the Navy. NAVMED P-117, Manual of the Medical Department (Change 126). Chapter 15, Physical Examinations and Standards for Enlistment, Commission, and Special Duty.
- Department of the Air Force Manual 48-123: Medical Examinations and Standards.
- Department of the Army Regulation 40–501: Medical Services - Standards of Medical Fitness.
- Department of the Navy SECNAVINST 6120.3A: Perodic Health Assessment for Individual Medical Readiness.
- Department of the Army Pamphlet 40–506: the Army Vision Conservation and Readiness Program.
- Department of Defense DODI 6130.03: Medical Standards for Appointment, Enlistment, or Induction into the Military Services.
- Departments of the Army, Air Force, and Navy. Army Regulation 40-63 (SECNAVINST 6810.1, AFI 44-117): Medical Services-Ophthalmic Services. Washington, D.C.
- Kempen JH, Mitchell P, Lee KE, et al. The prevalence of refractive errors among adults in the United States, Western Europe, and Australia. Arch Ophthalmol. 2004;122(4):495–505.
- Verhoeven VJ, Wong KT, Buitendijk GH, Hofman A, Vingerling JR, Klaver CC. Visual consequences of refractive errors in the general population. Ophthalmology. 2015;122(1):101–109.
- Li Y, Wang J, Zhong X, et al. Refractive error and risk of early or late age-related macular degeneration: a systematic review and meta-analysis. PLoS One. 2014;9(3):e90897.
- Ohno-Matsui K, Wu PC, Yamashiro K, et al. IMI pathologic myopia. Invest Ophthalmology & Vision Science. 2021;62(5):5.
- G. B. D. Blindness, Vision Impairment Collaborators, Vision Loss Expert Group of the Global Burden of Disease Study. Causes of blindness and vision impairment in 2020 and trends over 30 years, and prevalence of avoidable blindness in relation to VISION 2020: the Right to Sight - an analysis for the Global Burden of Disease Study. Lancet Glob Health. 2021;9(2):e144–e160.
- Ruiz-Medrano J, Montero JA, Flores-Moreno I, Arias L, Garcia-Layana A, Ruiz-Moreno JM. Myopic maculopathy: current status and proposal for a new classification and grading system (ATN). Prog Retin Eye Res. 2019;69:80–115.
- Haarman AEG, Enthoven CA, Tideman JWL, Tedja MS, Verhoeven VJM, Klaver CCW. The complications of myopia: a review and meta-analysis. Invest Ophthalmol Vis Sci. 2020;61(4):49.
- Hofmeister EM. Navy Refractive Surgery Program: 2020 Update at the Military Refractive Surgery Safety and Standards Symposium. Private communication, January 2020.
- Sellers B, Townley JR, Ropp C, Legault G. Brief report: refractive surgery trends at tri-service refractive surgery centers and the impact of the COVID-19 pandemic, fiscal years 2000–2020. MSMR. 2022;29(3):17–19.
- Gao H, Miles TP, Troche R, Murdoch DM, Koefoed VF, Cason JB. Quality of vision following LASIK and PRK-MMC for treatment of myopia. Mil Med. 2021; Feb 25:usab071.
- Army Program Executive Office Soldier (PEO-Soldier) Authorized Protective Eyewear List (APEL). Accessed 22 July 2022. https://www.peosoldier.army.mil/Equipment/Approved-Eyewear-QPL/